My #SundaySwing ideas week of 1/24 based on #TheStrat
What a week! I don’t have to mention that this #SundaySwing issue for the week starting at 1/24 is a bearish one. Surprise, surprise!
Due to the market volatility and the current conditions I won’t trade longer swings for now.
Earnings season starts as well for the big tech giants and since I don’t like to trade short before earnings, tech - besides the massive dip - is a no trade for me this week. Also there is not a single reversal setup that I like on AAPL, MSFT, FB and the rest of the gang. So I stay away from these.
Anyway, I think I found some okay-ish ideas with a confidence for shorter swings, but all as mentioned above, bearish.
I’m also showing you some extra Tradytics* Data for extra confirmation regarding the flow-site of the ideas.
TLDR;
- $EA 1/28 130p < 133.45
- $ABNB 2/18 135p < 152.41
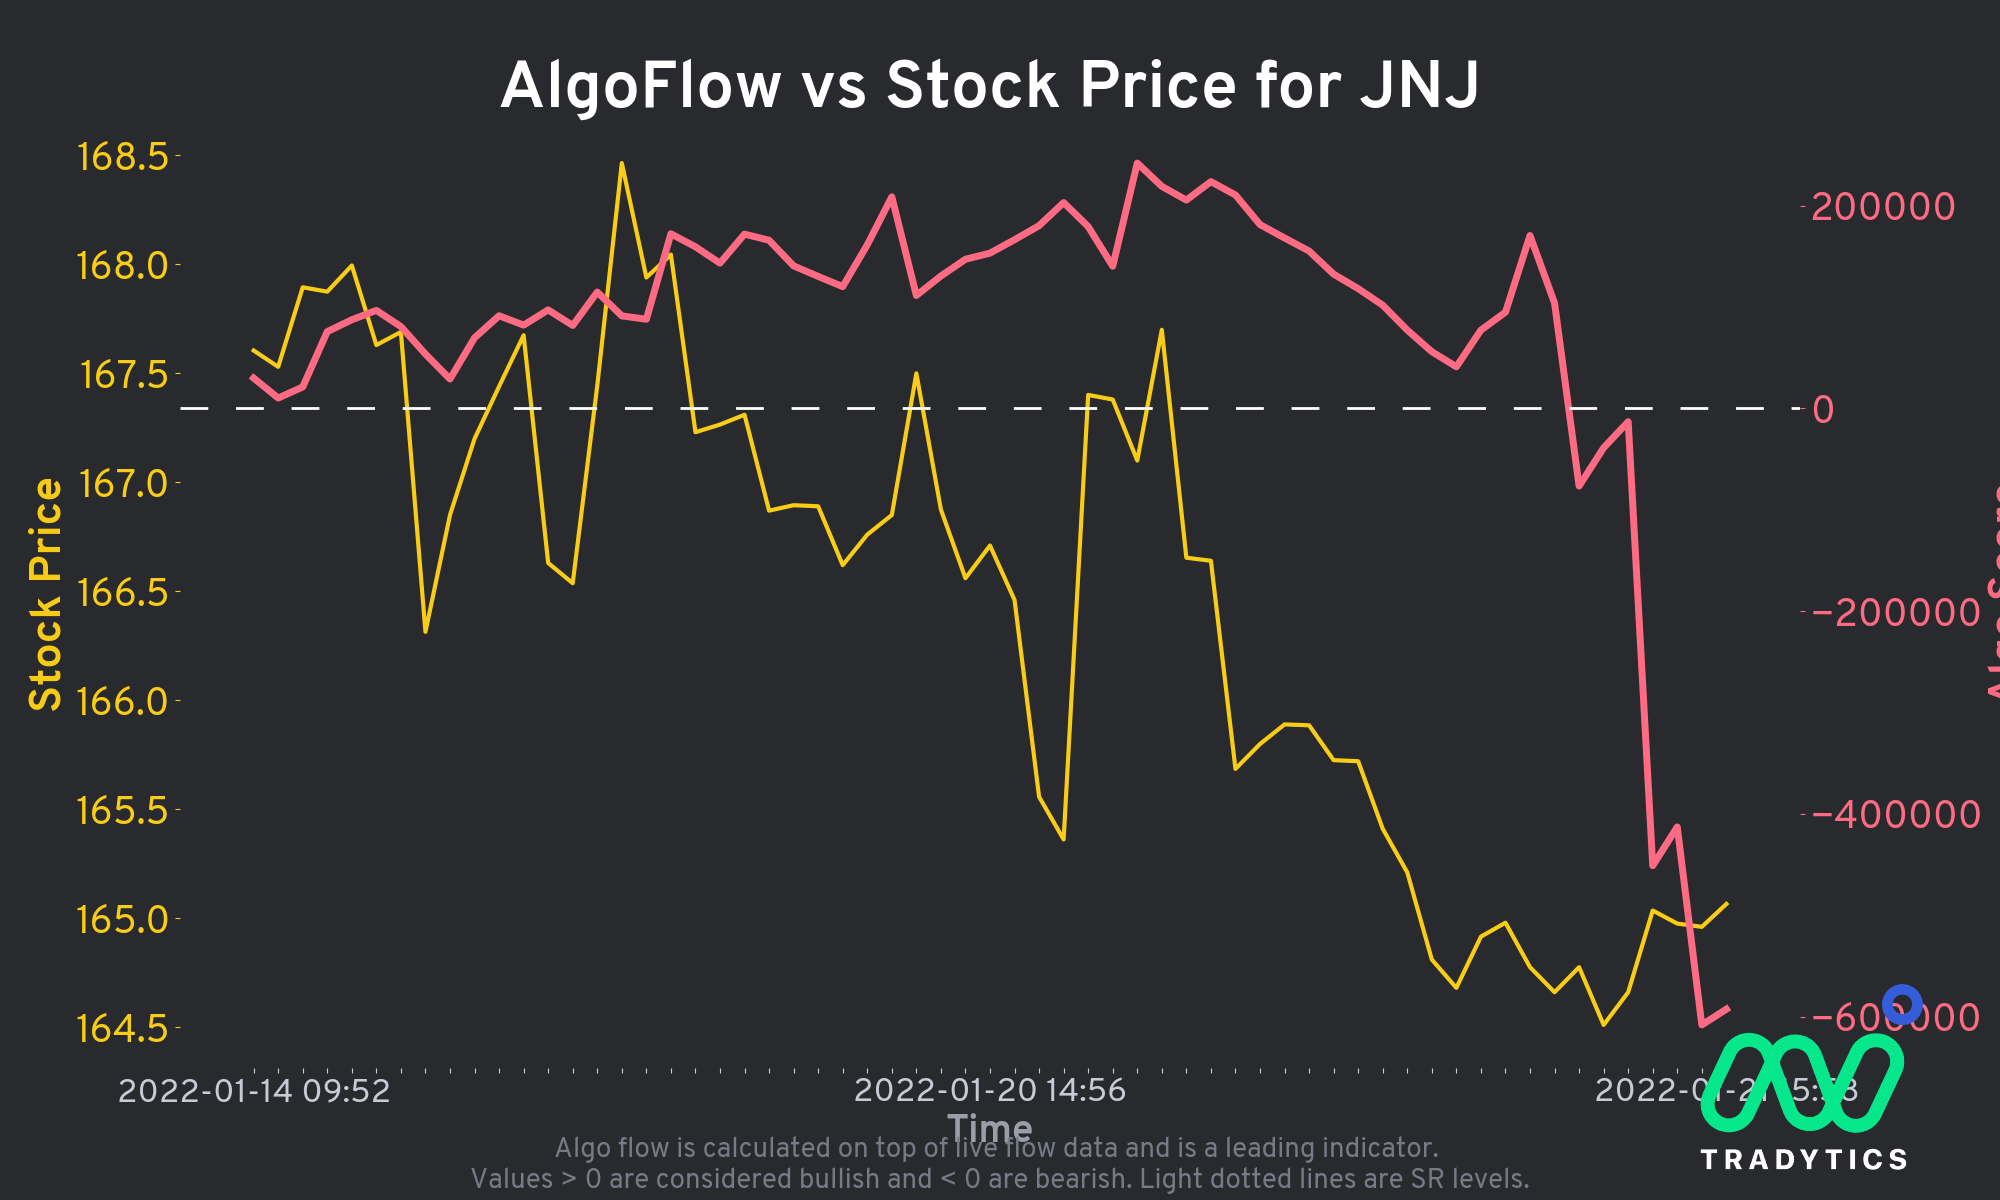
- $JNJ 2/18 155p < 164.47
- $KR 2/4 49p or 46p < 46.17
Let them open on Monday and better wait for Tuesday for an entry.
Recap of 1/16 SundaySwing
Two out of my 4 ideas triggered and both failed, based on the market conditions at end of week, there was no chance that this will work out. I started slightly bullish into the week, but bears took it down. So $BA and $FUTU triggered and failed. $NIO and $X never triggered, so no entry here, no money lost.
Disclaimer: No advice, instead these are my ideas based on my knowledge analyzing the charts for possible swing trades based on #TheStrat. So please always do your own due diligence before entering a trade.
Chart setups
Since I got always questions about the colors in my charts and the setups:
- I always chart in multiple time frames Monthly, Weekly, Daily, and 4-hour or 60min
- Purple lines last months high&low
- Orange lines last weeks high&low
- Blueish lines last day high&low
- Green lines are my targets
- Sometimes white and yellow for intermediate targets or 50% rule setups
- The brownish-boxes on the Daily and 4-hour chart you see sometimes show a gap that hasn’t filled yet.
If some of the broadening formation lines looking a bit curved, it is because I switched to logarithmic scale on the charts, but they are still correct.
Outlook
As always lets have a look at $SPY and $QQQ for a rough prediction of what I think the market will do next. Or course it’s just my interpretation, so keep that in mind!
$SPY
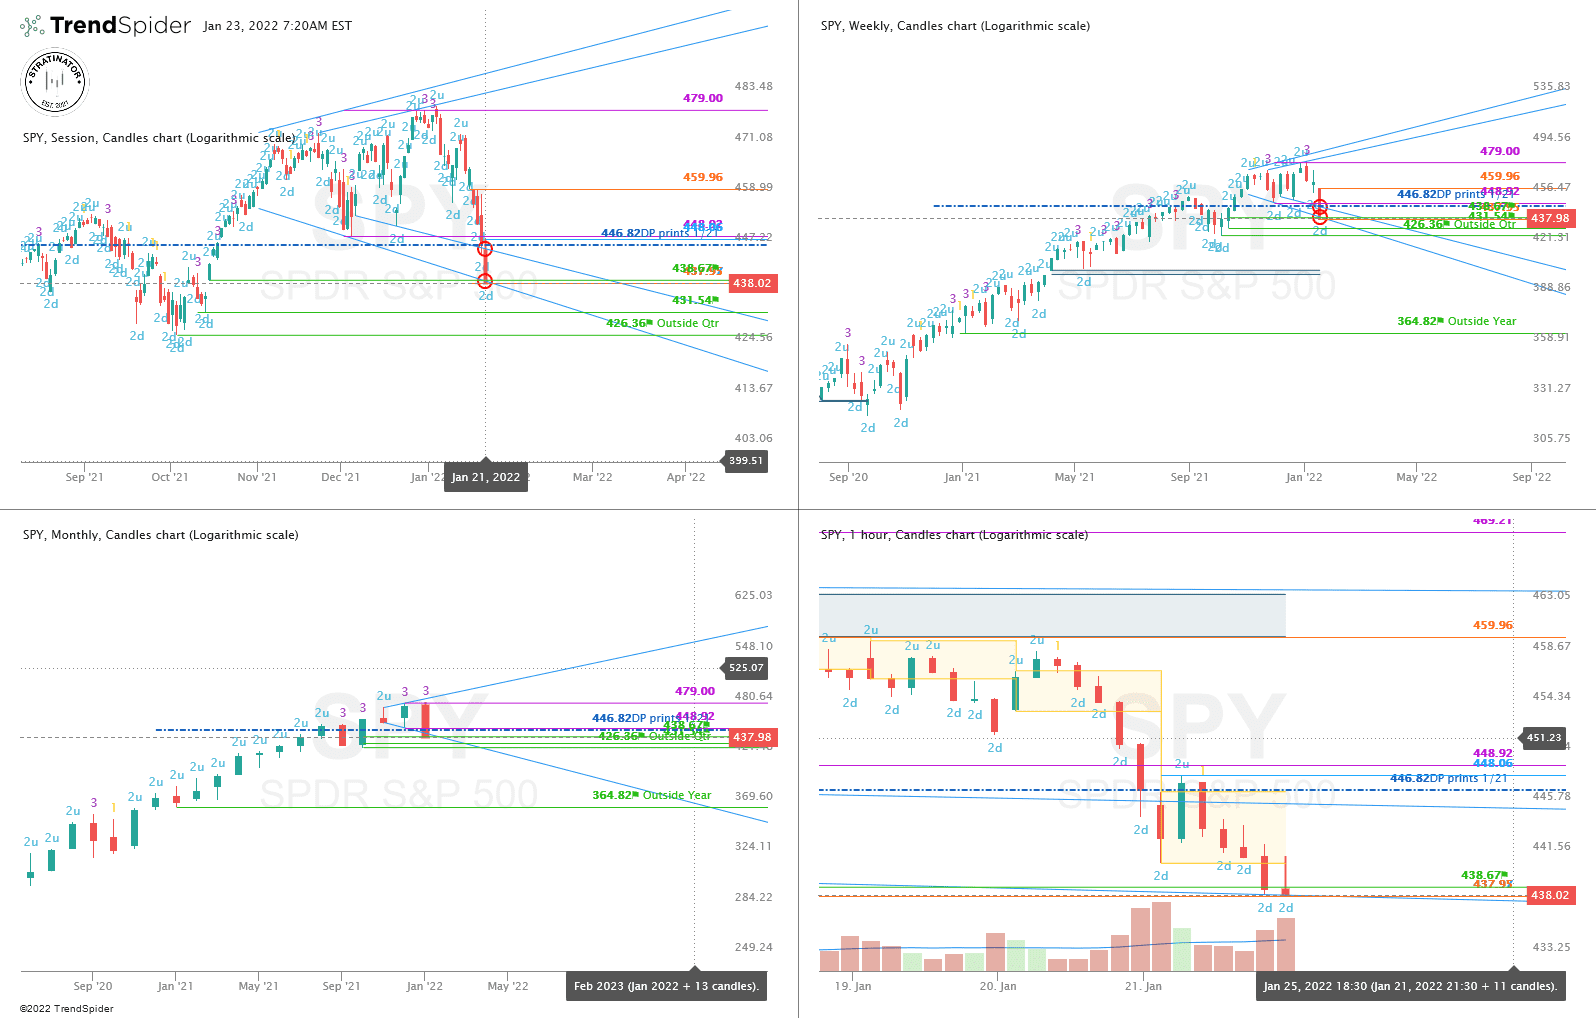
This looks bearish, except that small touch of the daily broadening formation below 438.67. So maybe(!!) we bounce up here because $SPY took out all the lows back to October 13th.
To give some more context, here is the larger view from TradingView for the Month, Qtr and 12Month candles.

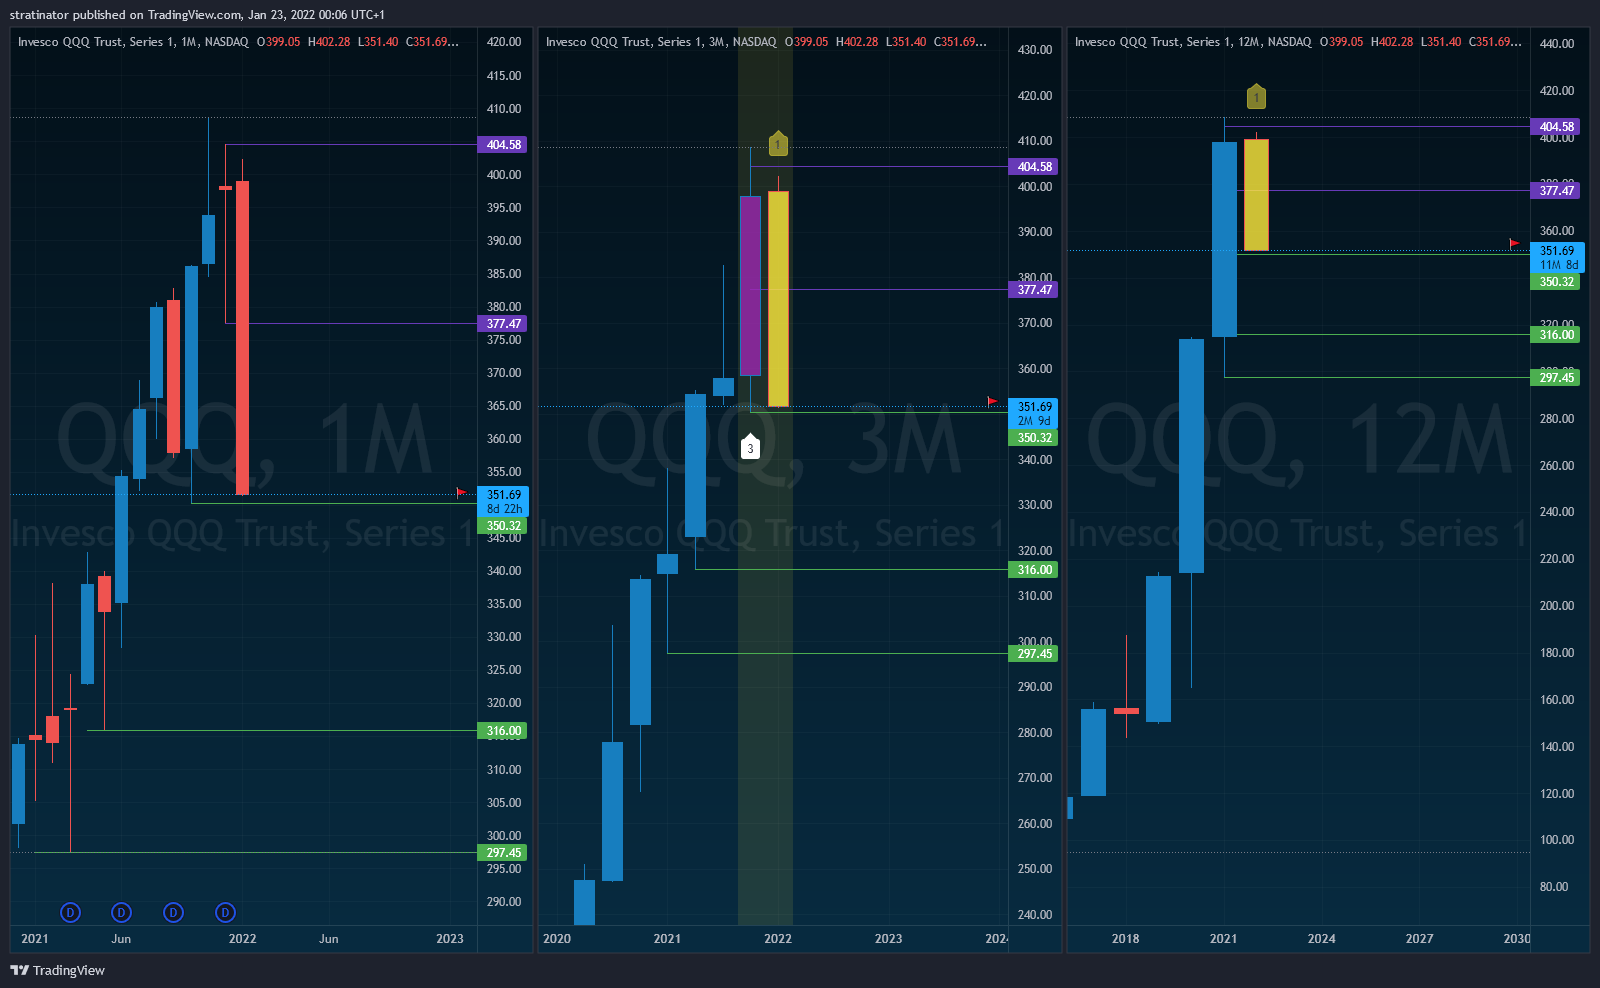
$QQQ

Here is a larger timeframe view of $QQQ on TradingView as well.
Profits and Stops
I usually target around 25-40% of profits on those swings and decide during the market hours if I leave a runner on a position or close the entire one.
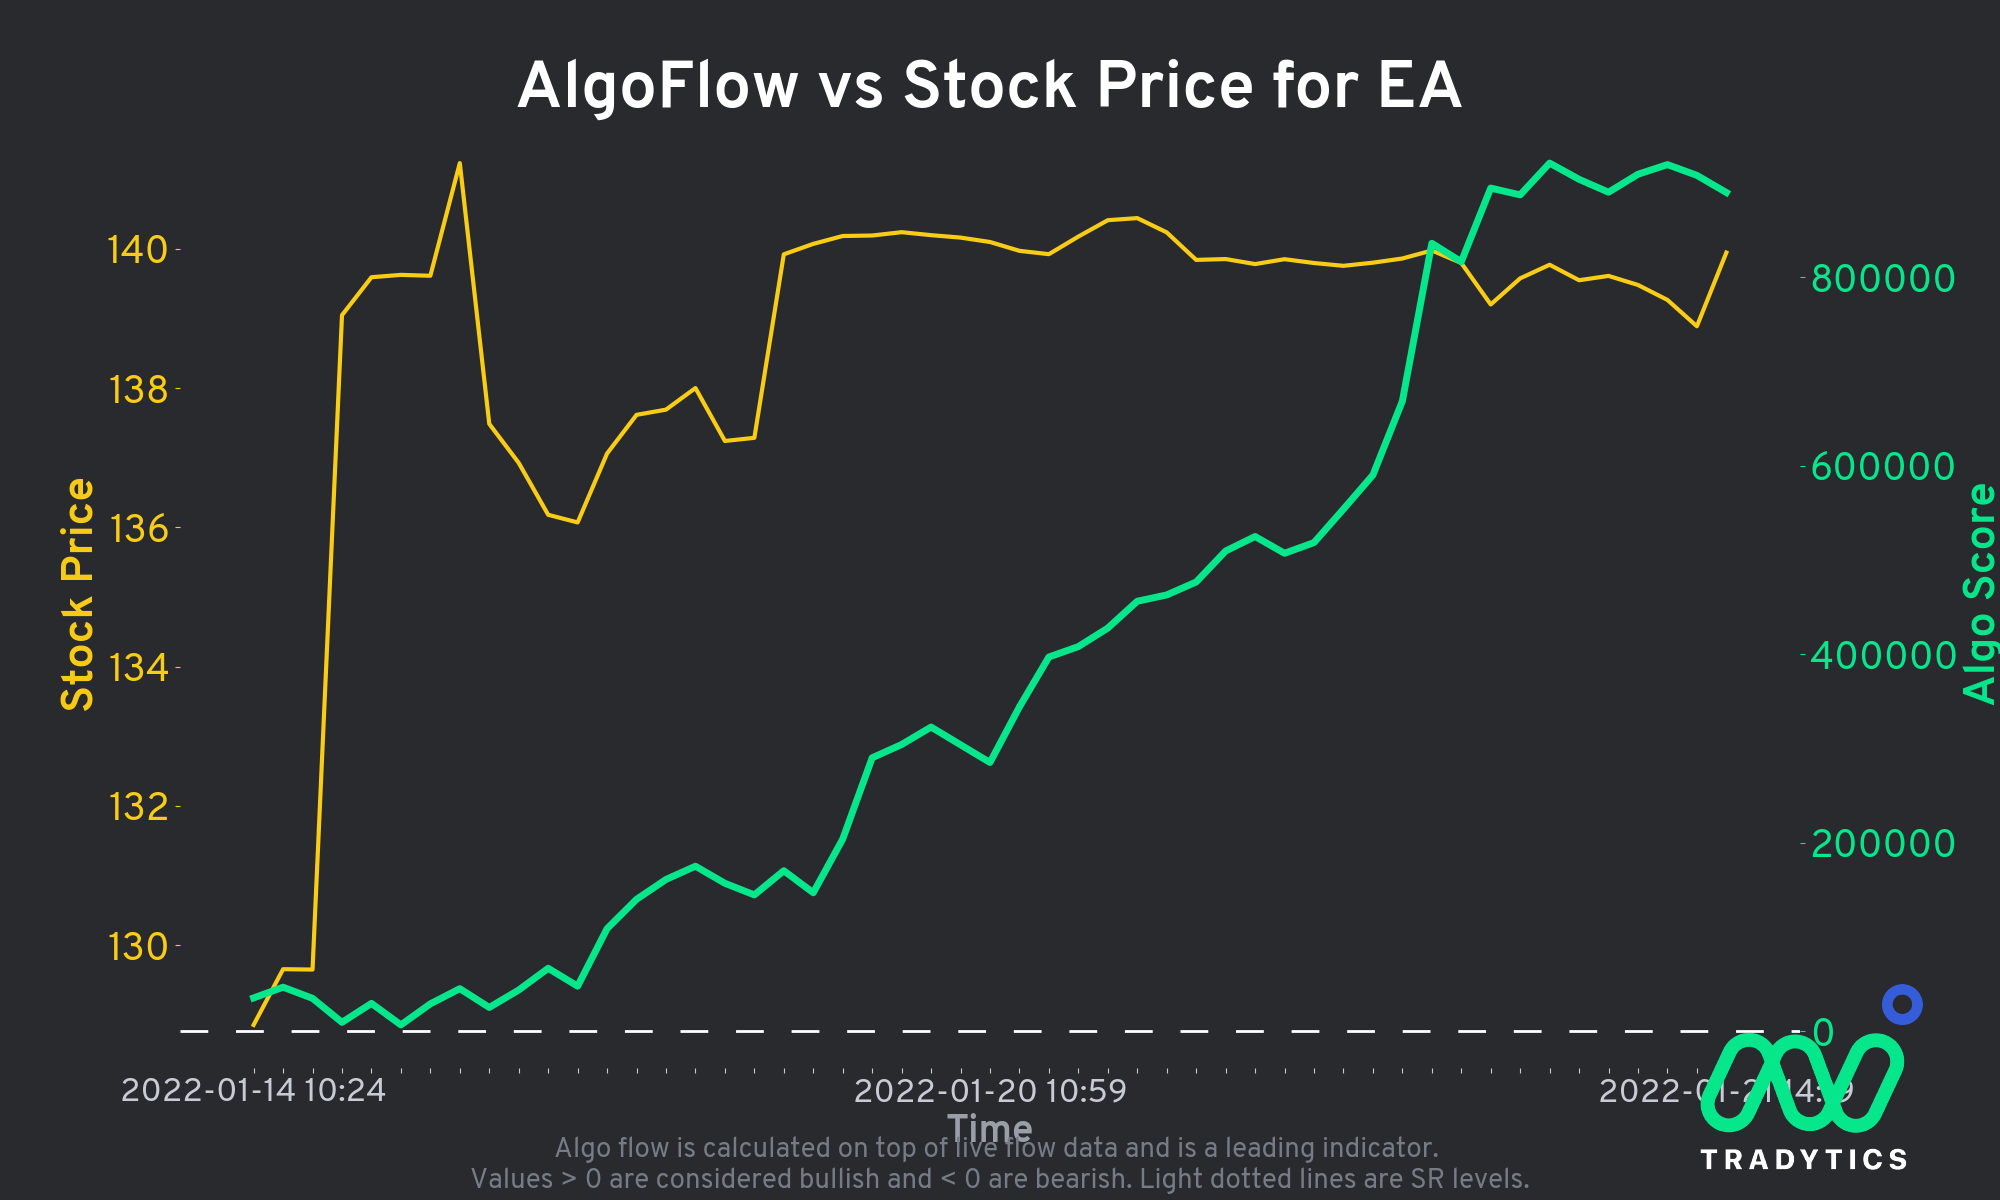
$EA 1/28 130p < 133.45
I was really surprised that a tech stock closed green last week, also in Friday. $EA still has M, W, D up, but the signs also look bearish with a possible 2-1-2d shooter on the daily. On the weekly we have a possible 1-2-2d setup and that’s the idea here. To not look at the daily setup and instead wait if if really triggers the week down below 133.45. The target there is 127.55 for me. Keep in mind that EA has earnings on 2/1 post-market, so that’s why I select that short weekly expiration which is way more risky here.
https://share.trendspider.com/chart/EA/37448qgjb7f

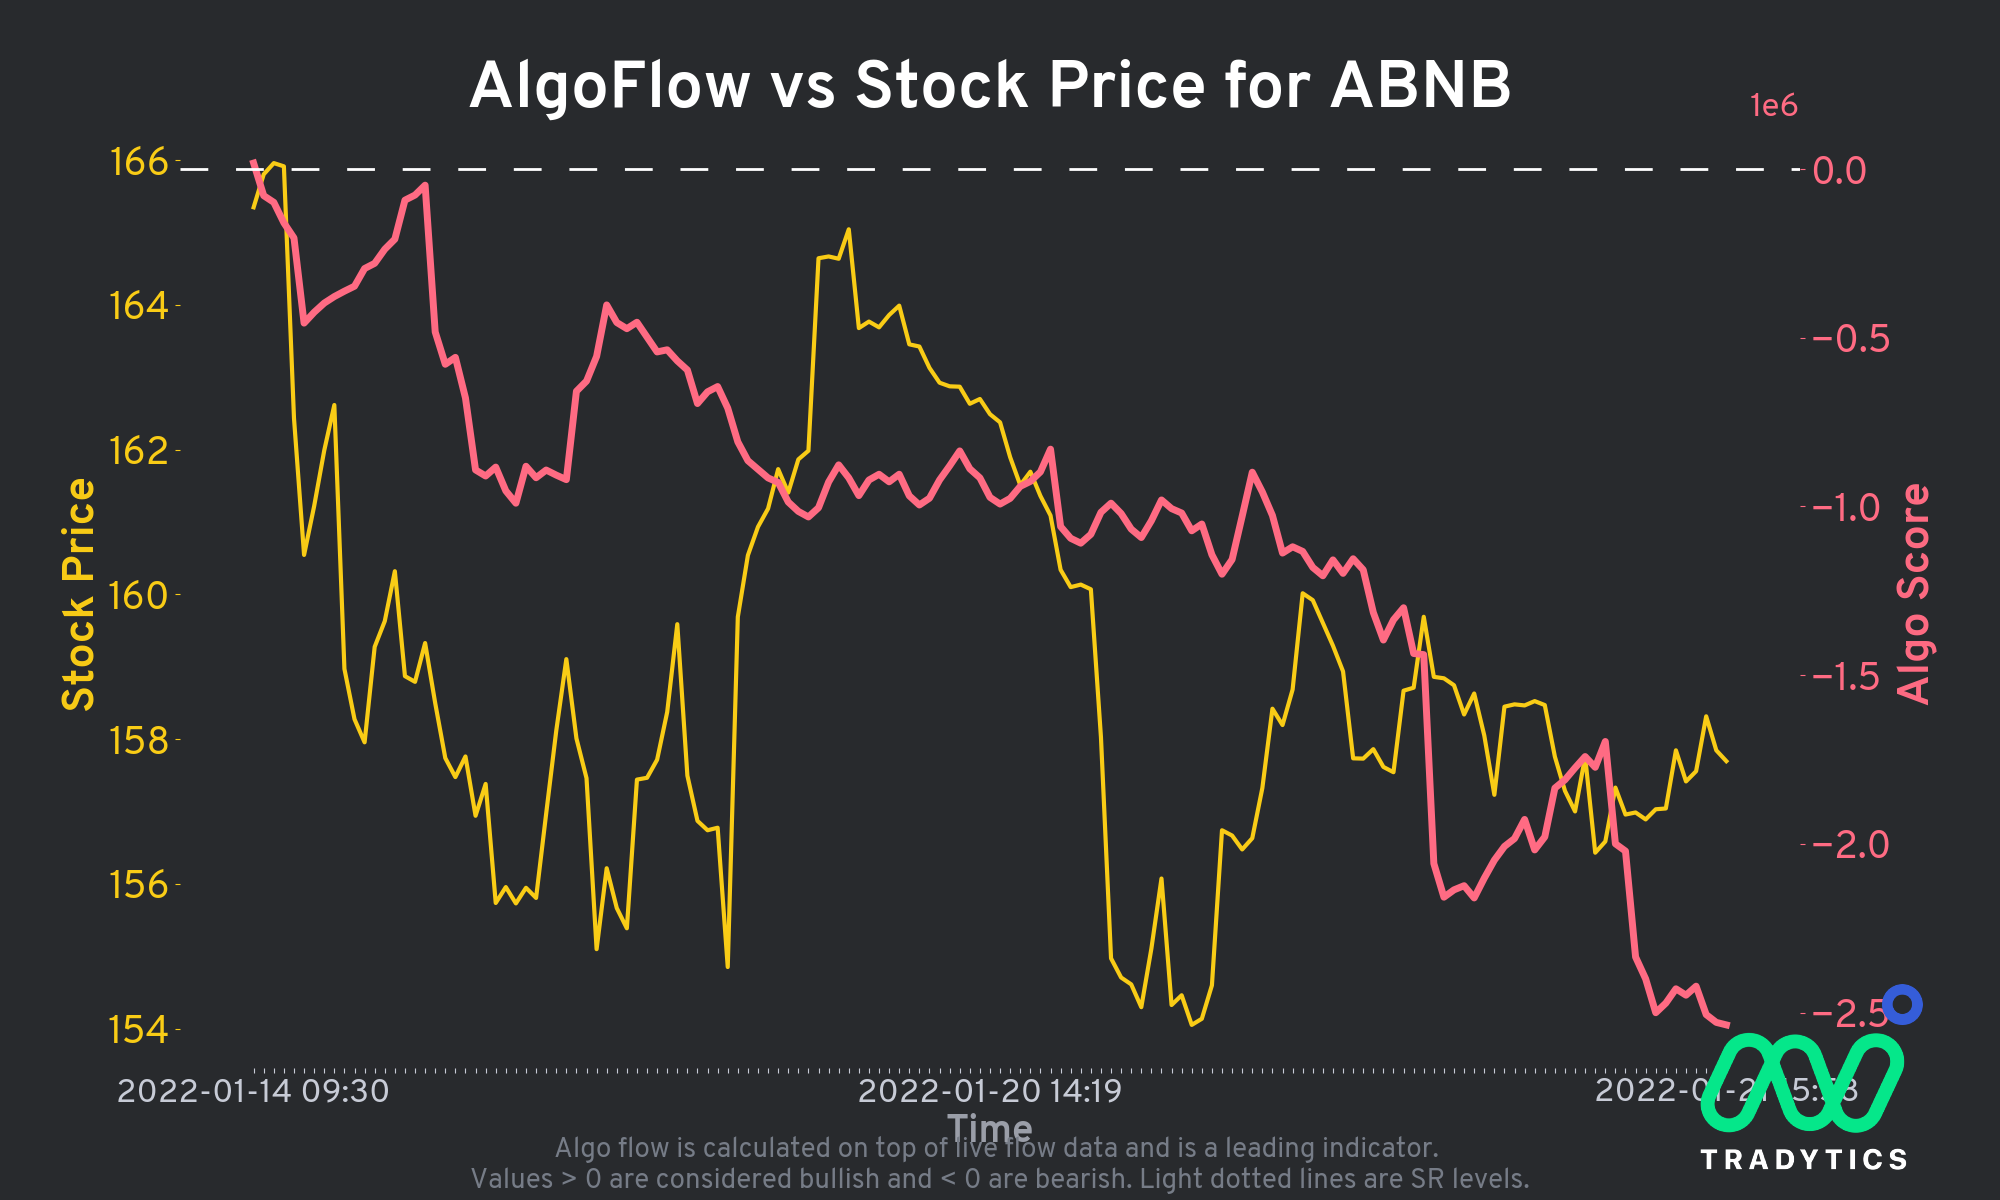
$ABNB 2/18 135p < 152.41
Trades currently at around $156, so the 135p sounds pretty aggressive, but I show you in a second why I think that could be a possible target. Month is currently still inside but we have FTFC down. On the week we have a possible 2d-1-2d Bearish Continuation. I wrote before that these are not my favorite setups, but target of the week 152.41 is near the monthly 2d trigger at 149.44. My next targets then are 141.50 and 130.31.

And here are the promised explanation why the 135p is a reachable target:

Keep in mind that this is the Qtr-Target, so I may roll the 135p out or close the contract, because $ABNB as earnings on 2/24.
$JNJ 2/18 155p < 164.47
Not my favorite setup, lets start with $JNJ this way, because they report earnings on 2/25 pre-market.
So anything can happen and I will not enter that trade if it triggers on Monday or Tuesday, no matter what happens. But if $JNJ will give me a nice reversal entry on the daily at or below 164.47 which is the week 2-2d continuation I’ll watch closely. The month is 2up and red and triggered the monthly 50% rule below 164.88 on Friday. So the next possible target for an outside month is 156.25.

$KR 2/4 46p or 48p < 46.17
The only real weekly reversal is $KR this week. Below 46.17 it triggers the 2-1-2d Bearish Reversal with a first target at 46.17 and maybe 44.52 if the market helps here. The month is still green and 2up so we’re in conflict currently and need 44.91 to turn it red. The 44.52 would aim for this as well. The extra confidence for the 46p comes this time from a large put order flow on Tradytics which I show you below.

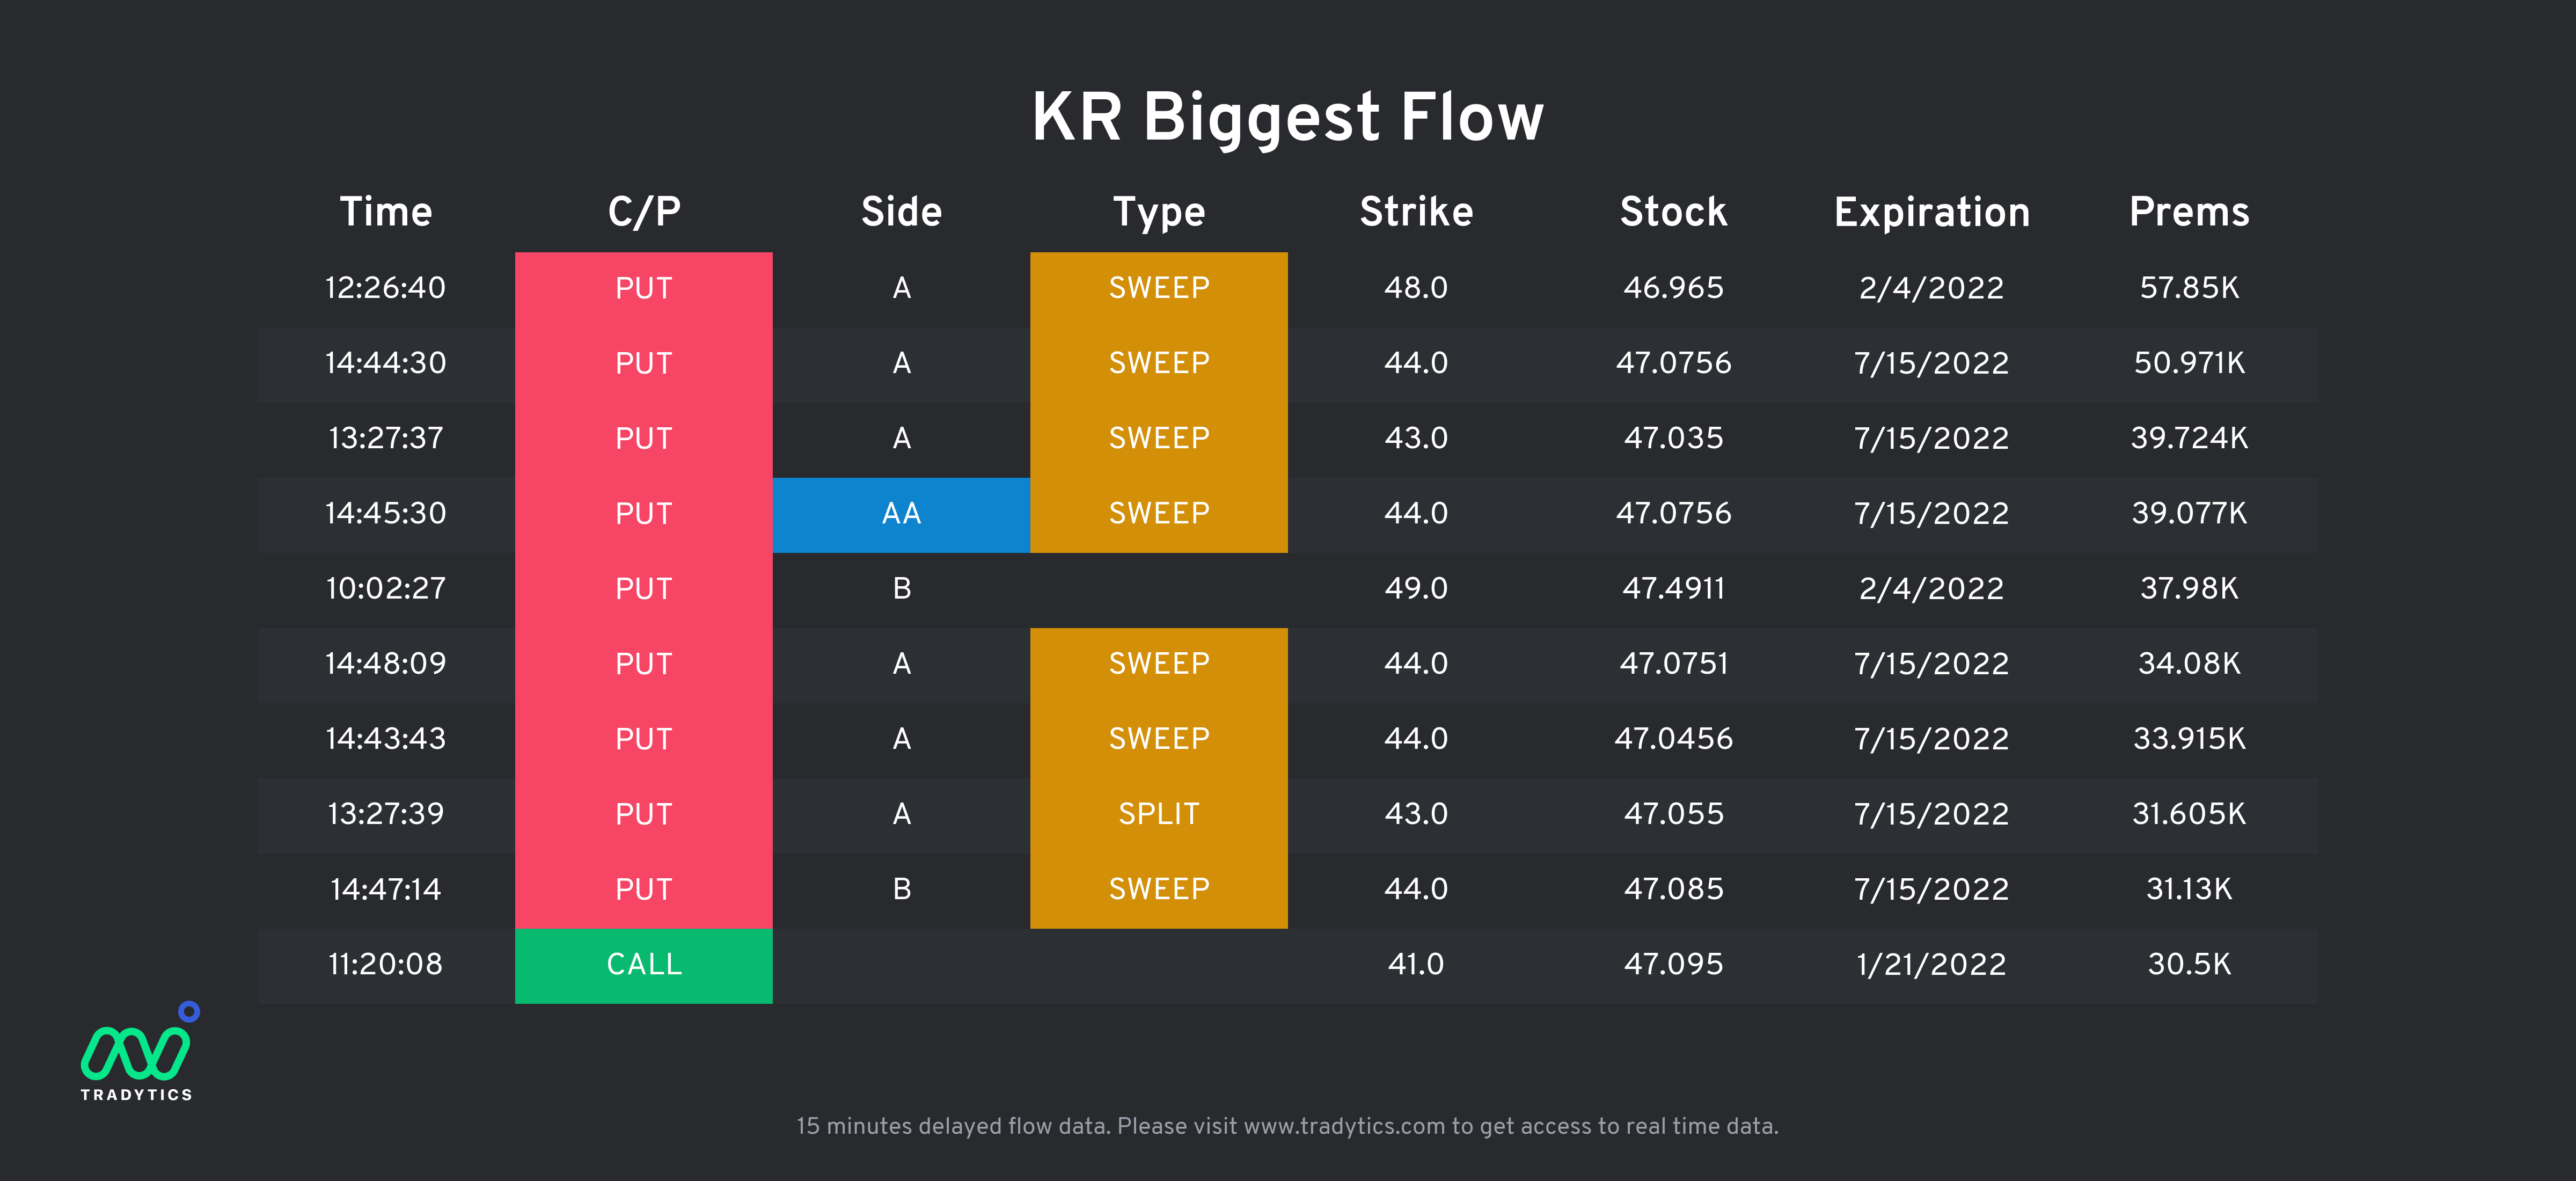
Flow info from Tradytics
Mentioned above, I’m currently testing Tradytics for additional confirmation of my strikes. The link to Tradytics is a referral link, so if you find that service also helpful and want to try it for yourself, I would appreciate it, if you use that link to support me.