My #SundaySwing ideas for the week of 2/7 based on #TheStrat
Another crazy week, and I think we will get some more, since #TheStrat loves volatility, I’m having a good time trading short-term swings and otherwise scalping SPY and QQQ during the day.
Most of the big-tech earnings reports are now a thing of the past and we might see some slowdown in that sector. However I focus still not on tech in this issue, because it’s so unpredictable currently. Even the results from MSFT or AAPL could help bring that sector in smooth water.
So I expect some more blood overall, see below for an in-depth analysis.
TLDR;
Mixed feelings for the next week, as you might notice when you see my trade ideas for it.
- $X 3/18 25c > 22.41
- $PEP 3/18 160p < 169.56
- $DKNG 2/18 20p < 20.33
- $BYND 2/18 55p < 56.53
Recap of 1/30 SundaySwing
I warned in the last #SundaySwing issue that we’re in a very volatile market and that also is visible in the results from last weeks ideas.
$AAPL gave an entry on Tuesday and was good until Wednesday, first target was hit, but 2nd target never.
$KO triggered for an entry and reached its targets and was profitable, however I thought theres was a bit more meat on the bone, but it also faded down in Thursday.
$OXY is the trade of the week so far and is still looking good. The 2/18 40c is ITM and we might see the 43.60 trigger, will decide next week if I cash out or roll out to a later date.
The only one that took a bit before lift-off was $WFC, it triggered lat in the week and has not reached my target of 58.11 for now, however, there are still 2 weeks left for the 2/18 57.5c.
Disclaimer: No advice, instead these are my ideas based on my knowledge analyzing the charts for possible swing trades based on #TheStrat. So please always do your own due diligence before entering a trade.
Chart setups
Since I got always questions about the colors in my charts and the setups:
- I always chart in multiple time frames Monthly, Weekly, Daily, and 4-hour or 60min
- Purple lines last months high&low
- Orange lines last weeks high&low
- Blueish lines last day high&low
- Green lines are my targets
- Sometimes white and yellow for intermediate targets or 50% rule setups
- The brownish-boxes on the Daily and 4-hour chart you see sometimes show a gap that hasn’t filled yet.
If some of the broadening formation lines looking a bit curved, it is because I switched to logarithmic scale on the charts, but they are still correct.
Flow info from Tradytics
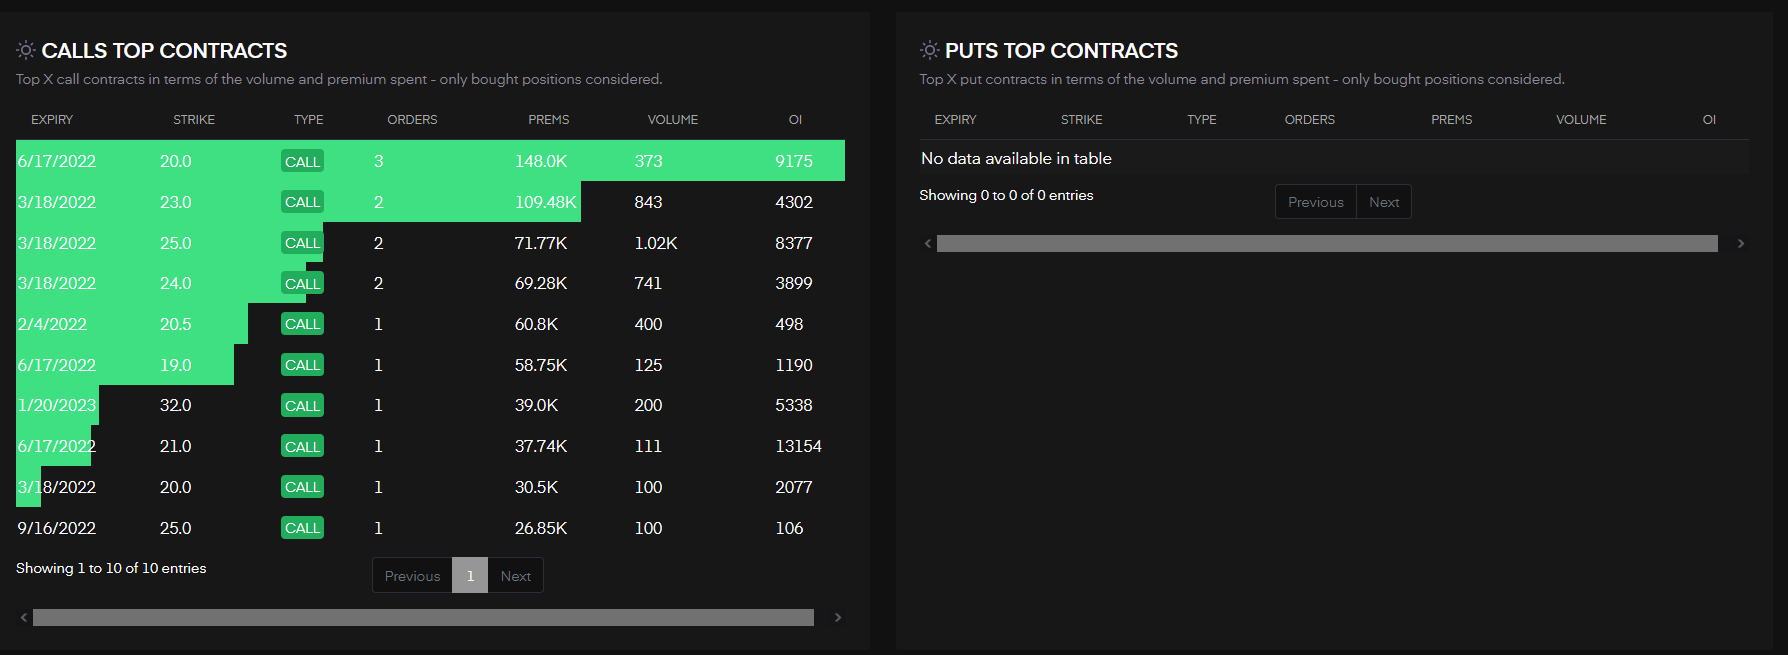
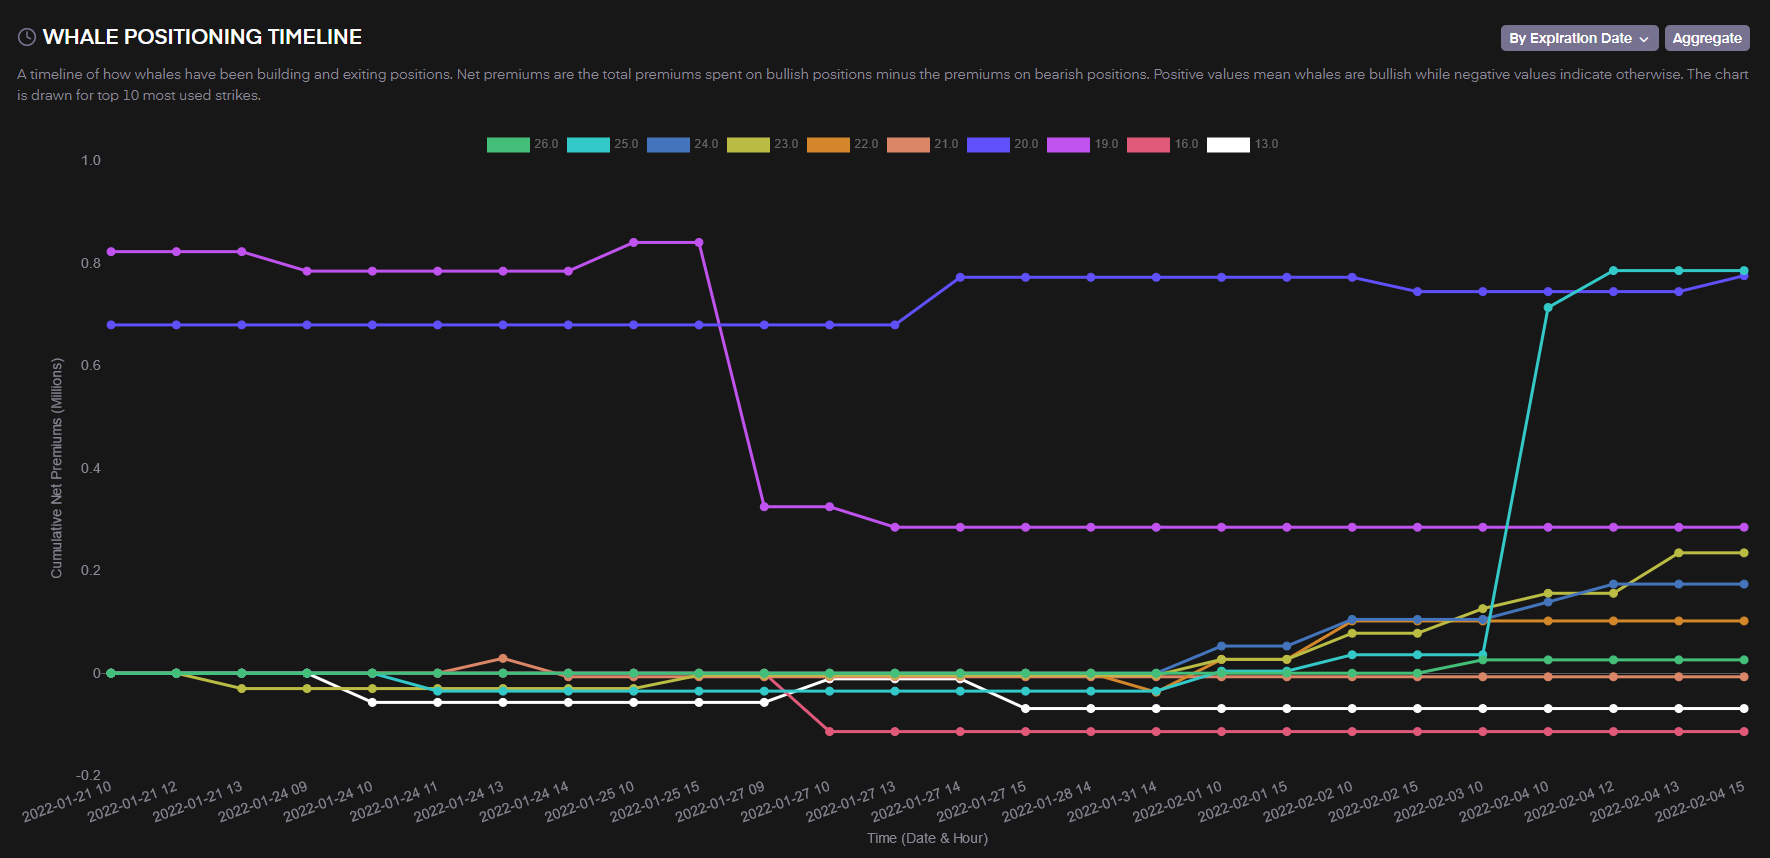
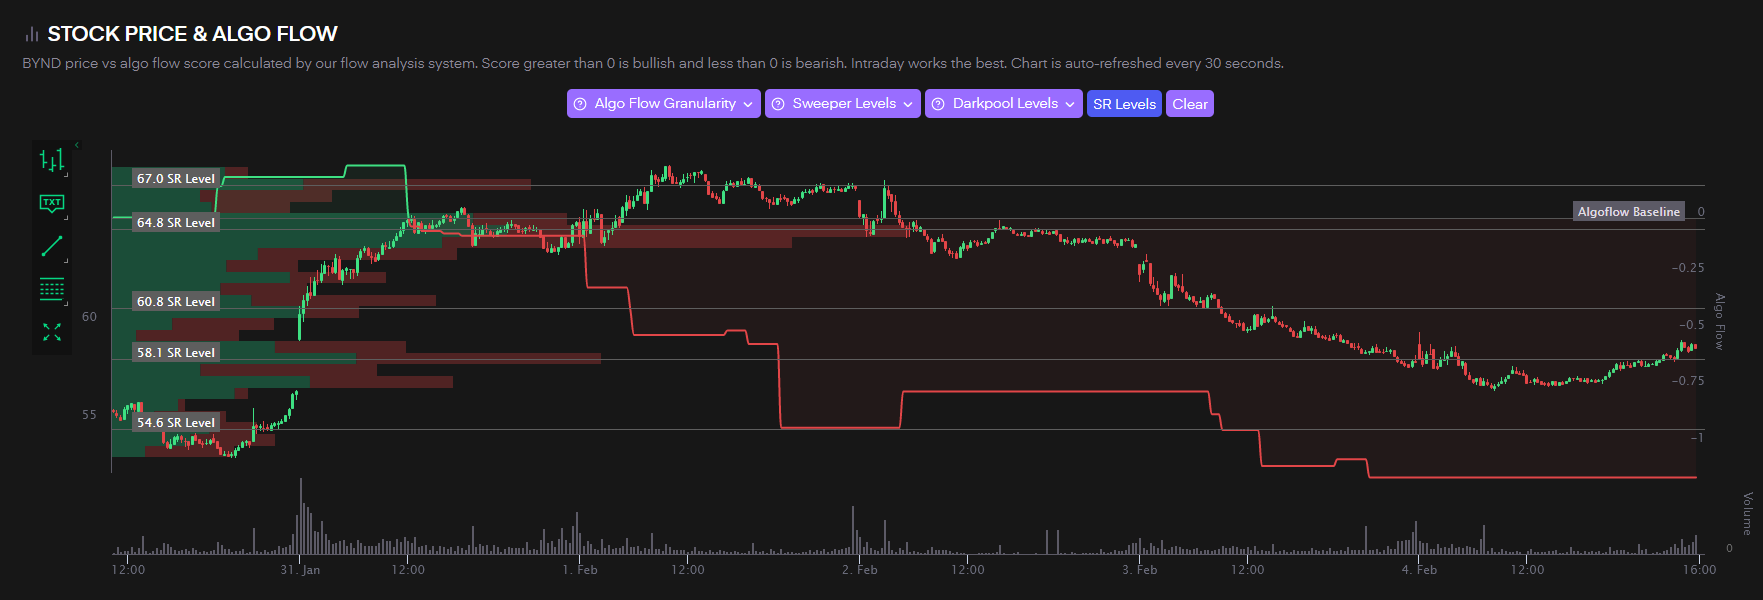
I’m adding Tradytics screenshots for additional confirmation of my strikes. The link to Tradytics is a referral link, so if you find that service helpful and want to try it for yourself, I would appreciate it, if you use that link to support me.
Outlook
As always lets have a look at $SPY and $QQQ for a rough prediction of what I think the market will do next. Or course it’s just my interpretation, so keep that in mind!
$SPY

No clear direction visible to me on $SPY. Month is slight red and right in the middle of that huge outside month January. Week is 2u and green but lost half of it’s gains on Friday. We moved over 20 points on SPY last week. This is more than on some months before, so everything is possible. Therefore no clear targets for me. However, we uncouple next week from the month and might have a better idea on what’s going on.
$QQQ

Since $QQQ and $SPY usually move nearly the same, that might be a hint for $SPY. Month is still inside with a slight direction to the downside targeting last months lows at 334.15. The week was 2up and green but clearly a shooter candle, which still takes 7 points down until we trigger a 2-2 Bearish Reversal on the week. Then the target would be the low of the month as mentioned.
Profits and Stops
I usually target around 25-40% of profits on those swings and decide during the market hours if I leave a runner on a position or close the entire one.
To view the charts in full detail, click to open them in a new browser window.
$X 3/18 25c > 22.41
Beginning with $X this week, the idea is to enter on a possible 2-2 Bullish Reversal Daily above 22.41 to get in a position for the 3/18 contracts. The week was a big green 2u and we’re still inside month but green. So FTFC is up.
Expecting a run into 25.02 as a first target and 26.17 as next target to trigger the 3-2u Monthly.
I chose this contract because it has plenty of time, is not expensive, covers earnings report on 2/28 and as you see below, got lots of flow from Tradytics as well.


$PEP 3/18 160p < 169.56
In times like these, we can also focus on some big slow movers that did well during the last couple of months. $PEP trading at ATH the last couple of months, the strategy here is to look on Puts because of exhaustion risk. The shooter - but still green - weekly candle last week give an opportunity to get in a trade if it breaks below 169.56 for a 2-2d Bearish Reversal Weekly. Earnings are next week, so if $PEP gives an entry right on Monday I will enter with a small position, because of ER risk. The 3/18 expiration gives plenty of time to.
My targets are 166.45 for the 2-2d Bearish Reversal Monthly trigger and then targeting the lows of December 2021 with 159.83.

$DKNG 2/18 20p < 20.33
A shorter expiration for $DKNG. Month is inside and red and the week is a shooter-like candle, but green. So as always I only enter if it breaks the low of that week below 20.33 for a 2-2d Bearish Reversal Weekly. The 20p is ATM then and with a bit momentum the magnitude of last months low 17.41 might get targeted.
On 2/18 $DKNG also reports earnings, so this is a safe expiration to exit before earnings.

$BYND 2/18 55p < 56.53
Another shorter expiration for this bearish trade idea. $BYND closed with a 2u red shooter last week. My entry would be the break of that 56.53 for a 2-2d Bearish Reversal Weekly with the target at 53.10. Earnings report is on 2/24, so also the contracts expire before that. The month is still inside but targeting the low of January for a 2-2d Bearish Continuation.
Tradytics AlgoFlow looks bearish as well for the next couple of days, however the biggest Calls & Puts are looking bullish. So we’ll see if the whales know something here.


That’s it for this weeks #SundaySwing issue. If you found some ideas or learned something from my thoughts, feel free to give me some feedback and share this post to help reach more audience and educate more people trading with #TheStrat.
Have a nice green successful week!


