My #SundaySwing ideas week of 1/31 based on #TheStrat
Since the high volatility and video production takes lot of my free time, I decided to not post a video to the ideas this week, so you have to read on if you are interested in this weeks #SundaySwing ideas.
We’re still in full earnings season, with $AMD, $F, $FB, $AMZN and $GOOGL reporting next week, so anything can happen. I also thought about that I pause releasing swing ideas and put a lot of work into the issues and videos because market is so volatile and what price action we have tomorrow could be completely different on Tuesday.
So please take the following ideas from me below with the proper mindset and don’t overtrade and focus really short term for now.
I’ll watch these closely and even if some of them trigger I decide if I really enter it or not. No automated trades with conditional orders for me currently, mostly watching and only scalping the markets with mostly $SPY and $QQQ calls and puts the whole week was fun.
TLDR;
The good thing is, I’m short-term bullish again, but take this with a grain of salt. I diversified the ideas this week to different sectors which hopefully works out :-)
- $AAPL 2/18 180c > 170.35
- $KO 2/18 62c > 60.93
- $OXY 2/18 40c > 38.93
- $WFC 2/18 57.5c > 55.51
Recap of 1/23 SundaySwing
3 out of my 4 ideas triggered and were profitable. $KR is deep ITM with the 46p or 48p currently, $EA ended also ITM on Thursday and $ABNB has some time left and was already ATM last week. The only idea I warned clearly was $JNJ, because of earnings and I was right, I didn’t traded it and they went in the complete opposite direction.
Disclaimer: No advice, instead these are my ideas based on my knowledge analyzing the charts for possible swing trades based on #TheStrat. So please always do your own due diligence before entering a trade.
Chart setups
Since I got always questions about the colors in my charts and the setups:
- I always chart in multiple time frames Monthly, Weekly, Daily, and 4-hour or 60min
- Purple lines last months high&low
- Orange lines last weeks high&low
- Blueish lines last day high&low
- Green lines are my targets
- Sometimes white and yellow for intermediate targets or 50% rule setups
- The brownish-boxes on the Daily and 4-hour chart you see sometimes show a gap that hasn’t filled yet.
If some of the broadening formation lines looking a bit curved, it is because I switched to logarithmic scale on the charts, but they are still correct.
Outlook
As always lets have a look at $SPY and $QQQ for a rough prediction of what I think the market will do next. Or course it’s just my interpretation, so keep that in mind!
$SPY

On Tuesday a new month starts and the current deep red month of January will end, so we have to wait and see in which direction price will trade, the range traded this month is huge, so will it be an inside month to the upside or more blood below January low of 420.76?
$QQQ

Interestingly, the bottom of the broadening formation on the month, we reach that line, pivot points for that line are the August and October 2021 lows. So February will show us if we might get a nice 2-1u or continue with a 2d-2d. Everything can happen.
Profits and Stops
I usually target around 25-40% of profits on those swings and decide during the market hours if I leave a runner on a position or close the entire one.
$AAPL 2/18 180c > 170.35
Back on my long swing list, still careful currently and not risking to much, because there are earnings reports in the tech branch as mentioned above. But last week looked good for $AAPL and since I’m an Apple Fanboy - bullish bias, full disclosure! - I aim for calls.
Month is still red, but we start a new one, so ignoring this for now here and focussing on the weekly and daily charts. Idea here is the 2-2u Bullish Reversal on the week with the next targets at 172.54 and 177.18. So the 180c contract I chosen above might be far OTM and I switch to the 175c before entering when it hits the trigger.
The 182.13 is the current months high and if we stay bullish, this is a high magnitude.

No data from Tradytics, because the flow for $AAPL is so huge even for the 2/18 expiration, and I still figure out flowtrades I’m not convinced of flow data and stick to the things I know - #TheStrat.
$KO 2/18 62c > 60.93
Coke was strong last couple of weeks when other stocks tanked, and still looks strong to me. However we are near all-time-highs, so if you look at the broadening formation we might be at exhaustion risk. The 62c contract for the short-term is a valid target to me and we might see new ATH before a corrective activity.
So the idea is the trade of the 1-2-2u Bullish RevStrat Weekly above 60.93, with the targets of 61.45 and maybe new ATH. The 62c is cheap but might have not enough time for a slow-mover like $CO. FTFC is up and month is 2u with no signs of a 2d for February so far.

Also not much flow volume on Tradytics that caught my eyes, so I stick to pure price action. AlgoFlow is slightly bearish in the 5d chart, so keep that in mind.
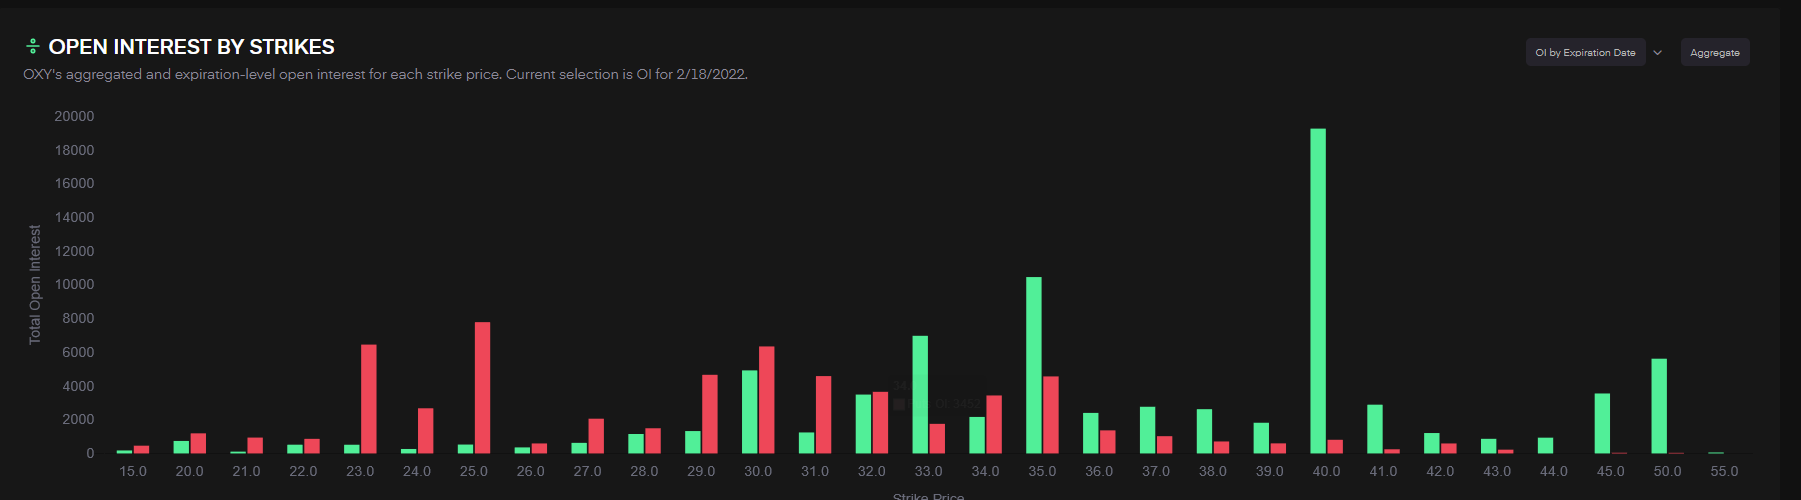
$OXY 2/18 40c > 38.93
Energy, energy is the sector that pumped since beginning of the year, and $OXY with a liquid option chain and cheap contracts compared to the others in the sector and nearly FTFC up (except on the Day), is my idea this time.
Idea is the weekly 3-2u Continuation, since Month is 2u and green I’m confident that we will see higher prices. Good thing also is, that $OXY traded a lot higher in the past, so we have targets we can aim for. My target for now is the Feb'20 high at 43.60. Trigger for an entry is the weekly break of the outside bar at 38.93.
As you might see from the drawn broadening formation, we might have exhaustion risk short-term and the daily chart currently can develop a 2-1-2d bearish Reversal, but since the month and week are strong I look at the upper side for a trade.

Finally some Tradytics charts :-)
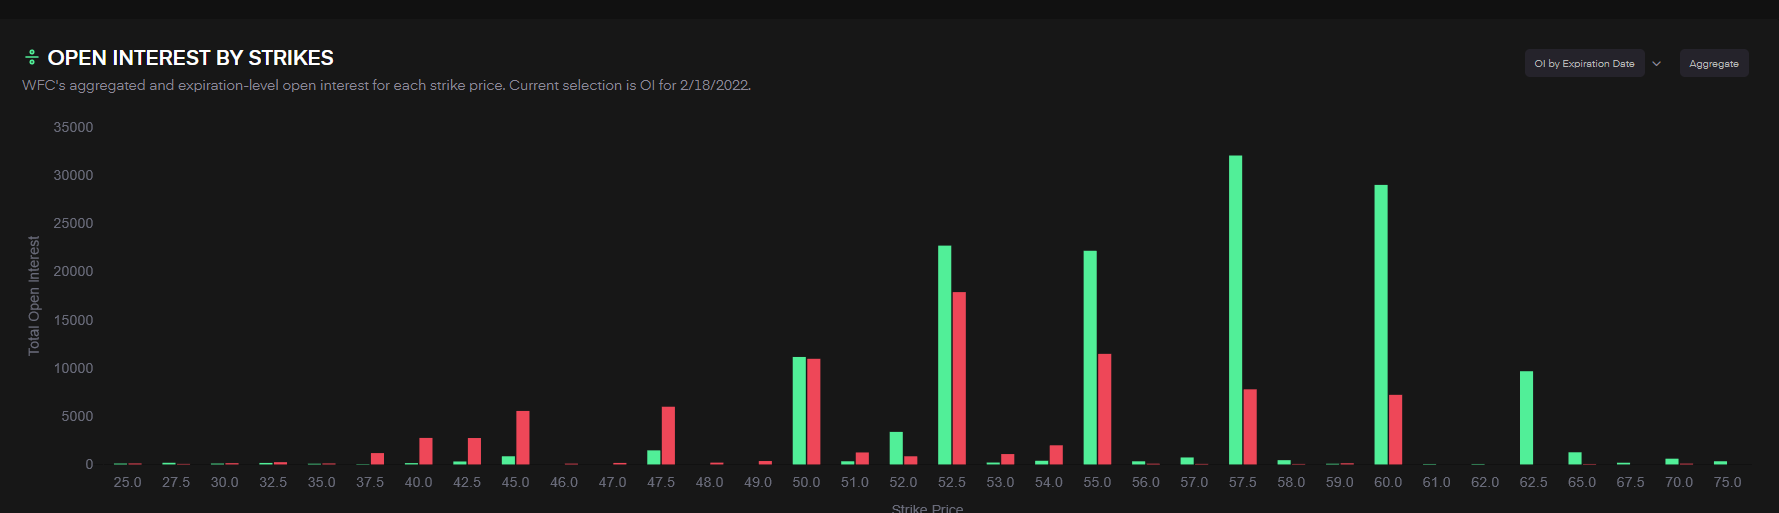
$WFC 2/18 57.5c > 55.51
Finance sector was also quite strong, so $WFC caught my eyes here. FTFC is up, month 2u in force and week 2d but green.
My idea here is the 2-2u Bullish Reversal weekly above 55.51. Also the Daily chart with the possible 3-2-2u Reversal looks promising to the upside. The target if 55.51 triggers is the high of the week before at 58.11 currently. Since the contract has 3 weeks time to play out, this is possible for a slow mover like $WFC.

The AlgoFlow from Tradytics is bearish, but looking at the OI for the 2/18 it doesn’t look that bad to me. Keep in mind that I’m not that experienced in flow-analysis, yet.
Flow info from Tradytics
Mentioned above, I’m currently testing Tradytics for additional confirmation of my strikes. The link to Tradytics is a referral link, so if you find that service also helpful and want to try it for yourself, I would appreciate it, if you use that link to support me.
Have a great weekend and an awesome week ahead! Feel free to share this post if you find it helpful to help any one else who might need it.