My #SundaySwing ideas for the week of 3/21 based on #TheStrat and @Tradytics
I’m still unsure if last week was a bull run because of OPEX and Quad-Witch-Week or what caused this 4 massive green days in a row. Nearly 30 points straight up for SPY without a pause. Crazy!
I’m cautiously bullish this week, but as most traders know, there must be at a healthy pullback, that massive gain in such a short time can’t be good for the market. So my ideas for this week are all bullish, but if I see some sort of pullback or maybe even last week was a bull-trap I’ll put my bear-pants on again in the same second.
As I wrote some days ago, you’ve to adapt quickly in 2022 to survive in this shark tank. As you might know, I love to trade and scan and train my eyes for possible setups, so I had to spend some extra-time on my scanners and charts to bring this weeks #SundaySwing issue to you.
Loyal readers have probably also noticed that I’m posting 5 ideas this week instead of the usual 4, added $PLUG as a bonus this week after I already selected 4 ideas.
Newsletter
If you want to read my #SundaySwing ideas and some other posts I write right in your email inbox, you can subscribe to my totally free Newsletter.
TLDR;
As mentioned above, only calls this week on my list. I will not trade against the market and go with the money. So currently bullish until some cool-down.
A mixed bag of sectors to diversify the money in the market.
- $CLX 4/14 140c > 134.76
- $BLNK 4/14 30c > 25.96
- $PLUG 4/14 30c > 26.36
- $OXY 4/14 65c > 58.19
- $AAPL 4/14 170c > 164.48
Recap of 3/13 SundaySwing
Last weeks #SundaySwing ideas:
- $AAL 5/20 18c - triggered and is on its way to the first target 17.07 (Contracts are up ~100%)
- $TGT 4/14 190p - market decided the other way, no trigger, invalidated setup
Glad I took profits on all the puts that I swung from the week before ($BYND, $PINS).
Disclaimer: Not advice, instead these are my ideas based on my knowledge analyzing the charts for possible swing trades based on #TheStrat. So please always do your own due diligence before entering a trade.
Chart setups
Since I got always questions about the colors in my charts and the setups:
- I always chart in multiple time frames Monthly, Weekly, Daily, and 4-hour or 60min
- Purple lines last months high&low
- Orange lines last weeks high&low
- Blueish lines last day high&low
- Green lines are my targets
- Sometimes white and yellow for intermediate targets or 50% rule setups
- The brownish-boxes on the Daily and 4-hour chart you see sometimes show a gap that hasn’t filled yet.
If some of the broadening formation lines looking a bit curved, it is because I switched to logarithmic scale on the charts, but they are still correct.
Outlook
As always, lets have a look at $SPY and $QQQ for a rough prediction of what I think the market will do next. Or course it’s just my interpretation, so keep that in mind!
I’m looking from target to target on the weekly and not get overly bullish for now and see what price does after hitting one of the targets.
$SPY
Mentioned above, 4 bright green days on $SPY, bulls are back for now. There must be a a pullback at some point, but who knows when?
For now, $SPY is back at FTFC up with that move last week. So for now we’re looking on the upper targets.
Continuations are always difficult to trade, month is still inside until 458.12 breaks, which as 14 points away as of this writing. My next targets on the chart ar on the weekly, 448.05 and 451.61.

$QQQ
Look bearish last week and now here we are with $QQQ also FTFC up. Bears worked hard to fullfil the 2d on the month and after hitting that magnitude (318.26) it reversed. FTFC up, so bulls are in control for now.

Profits and Stops
I usually target around 25-40% of profits on those swings and decide during the market hours if I leave a runner on a position or close the entire one.
To view the charts in full detail, click to open them in a new browser window.
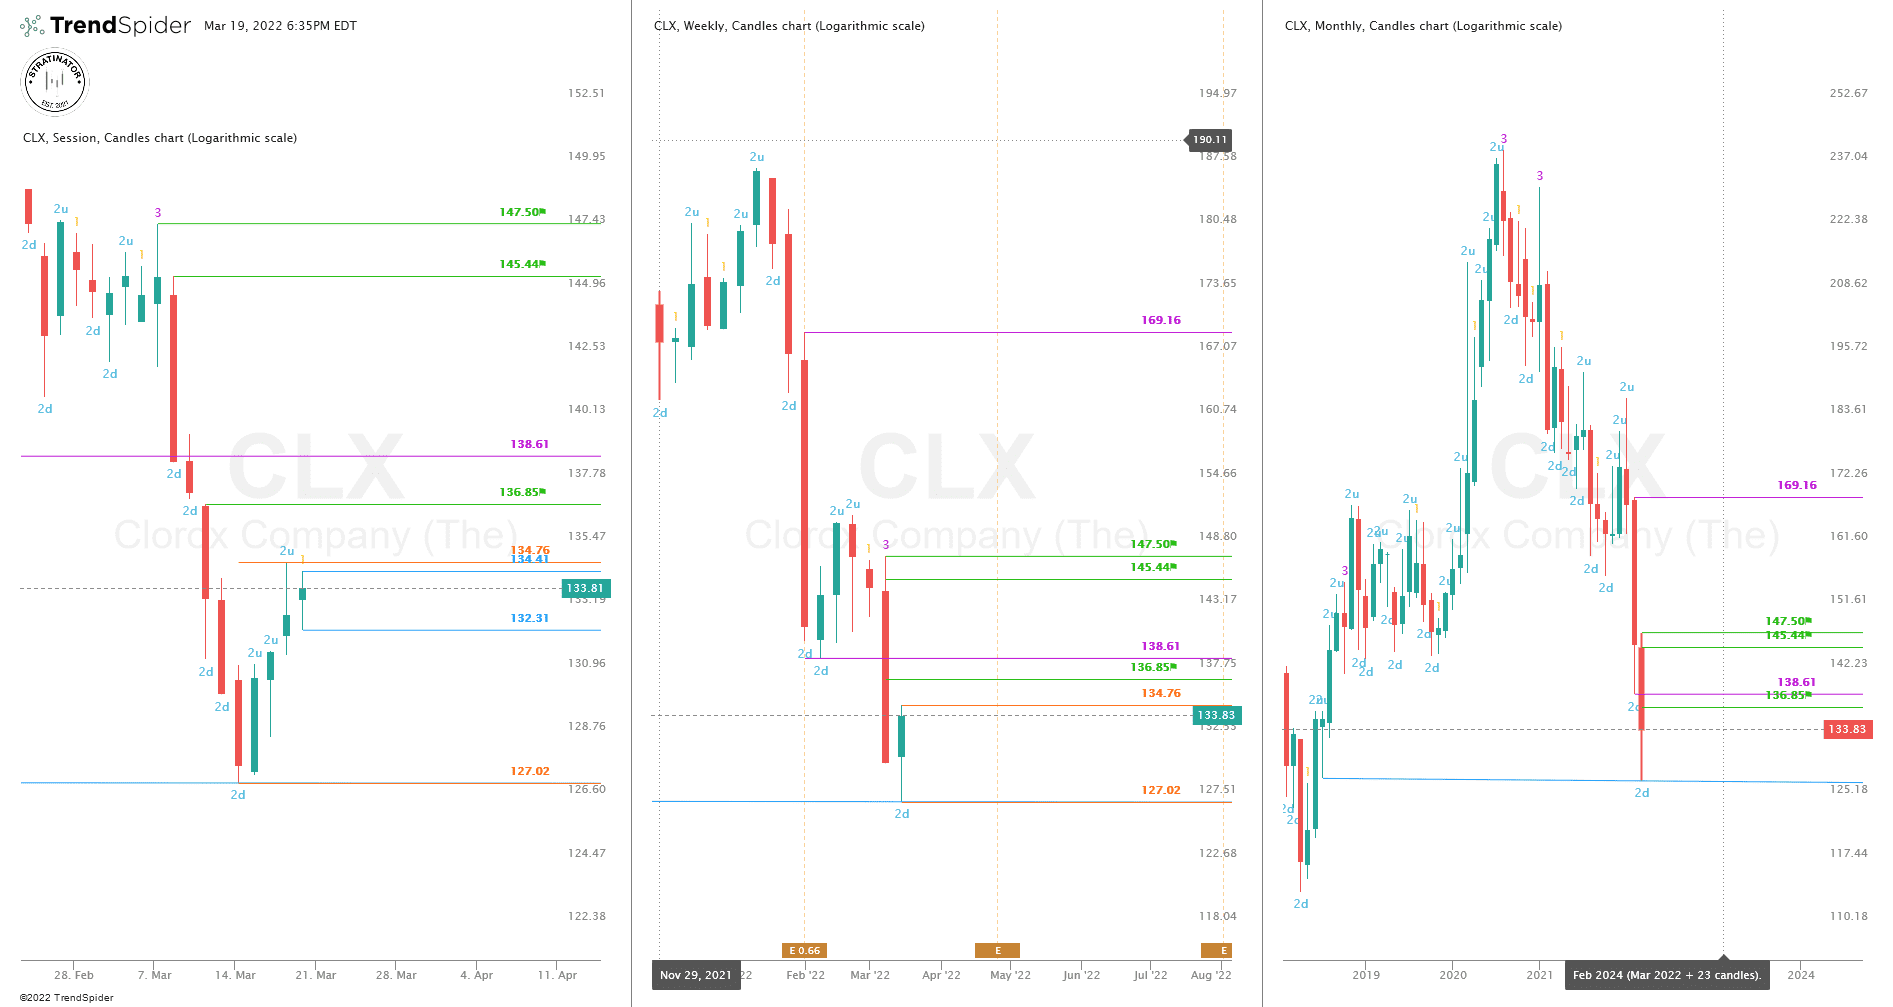
$CLX 4/14 140c > 134.76
Not the usual stock on my list, but my scanners found it because of a good looking 2d green week. The idea is a 2d-2u Bullish Reversal Weekly above 134.76. Since Friday was an green inside day, that level could trigger soon. Month is still deep red, but last week $CLX took out June 2018 lows and reversed. So $CLX have a good chance of exhaustion risk on the monthly as well and we could see a reversal here.
Since the candles are pretty big on the weekly, my intermediate-term targets are from the daily chart, 136.85, 145.44 and 147.50. The price at 145.28 turns the month green into FTFC up.
Not the most liquid option chain, so keep this in mind! $CLS has earnings on 4/29 so I currently stick to the shorter expiration and avoid the earnings.
$BLNK 4/14 30c > 25.96
Still an inside month green hammer near taking out last months high of 25.96. That is also the idea here above 25.96 for a 2d-1-2u Bullish Reversal Monthly. Outside week last week closed near that trigger as well, FTFC is up, so it looks like BLNK has some charge left to go up.
The next targets are from the monthly 27.79 and 29.15 from the weekly chart.
The option chain is a bit weird here, because on the 5/20 expiration which would be my favorite here, there is no Volume or OI and highest strike is 29c. So I stick to the shorter expiration and keep an eye on my profit level if $BLNK triggers.
Like on $CLX above, not the most liquid option chain so I pay extra attention to the premium and spread when entering.

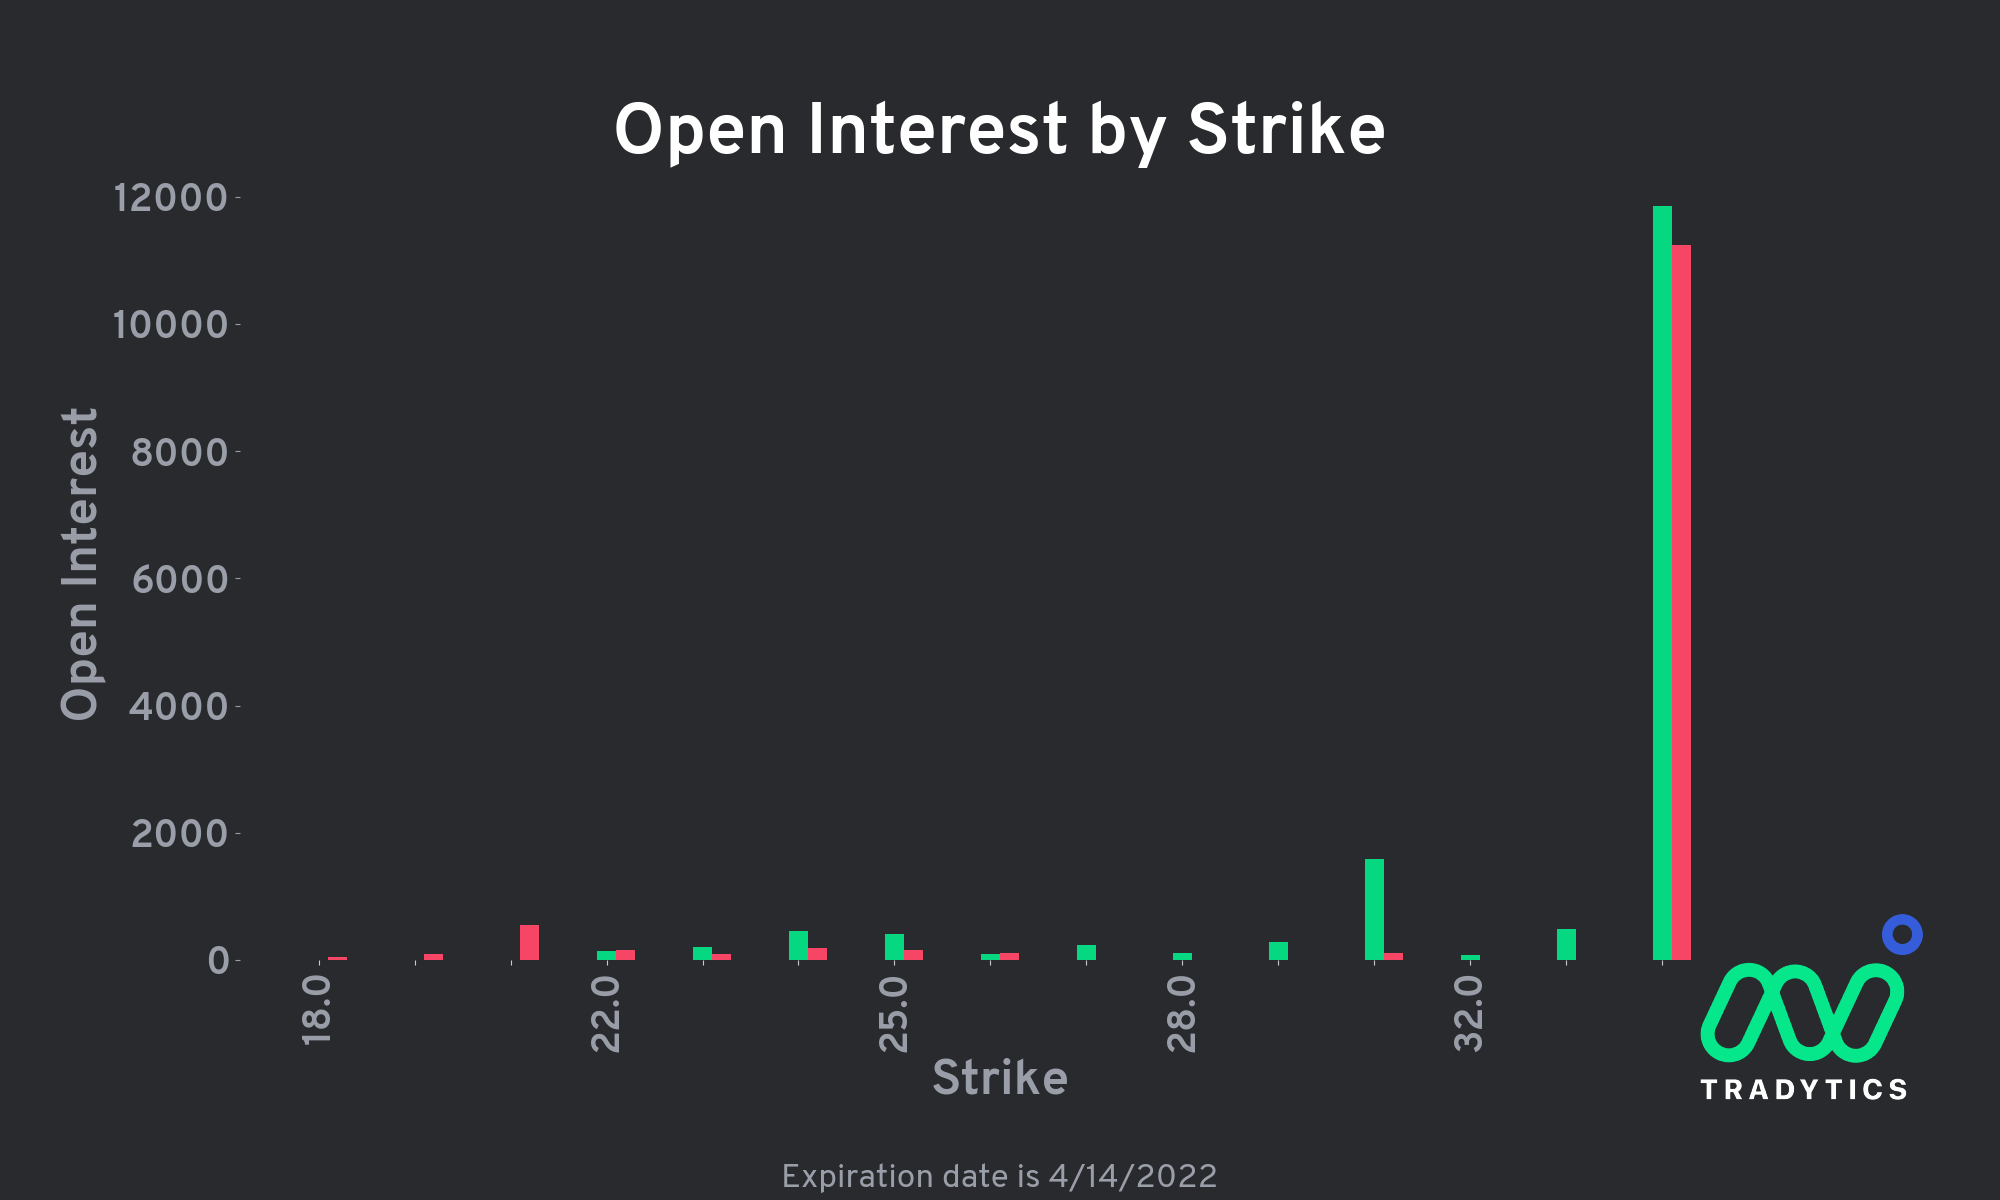
Tradytics $BLNK flow analysis
The 6/17 expiration has much more flow on higher strikes, but earnings on 5/12 let me stick to the 4/14 expiration.
Also have a look at the OI for 4/14 expiration if you look for a higher strike with cheaper premium.
$PLUG 4/14 30c > 26.36
If $BLNK above works, $PLUG might also run up and since $PLUG has a better option chain this might be an alternative as well.
Idea here is the 3-2d-2u Bullish Reversal Weekly above 26.36. FTFC is up and month is 2u in-force. Weekly target next is 26.74 and then on the monthly chart 29.27.

$OXY 4/14 65c > 58.19
Energy sector lost money last week because money was moved to other sectors. If this changes I still think that energy goes up. Month and Week are both green, Month 2up in-force. Looking for a 2u-1-2u Measured Move Weekly above 58.19 into highs from 2019. Targets are 60.73, 63.42 and 68.83.
The risk on $OXY is mid-term exhaustion risk on the upside and it could drop if sector also loses power, so please keep that in mind.

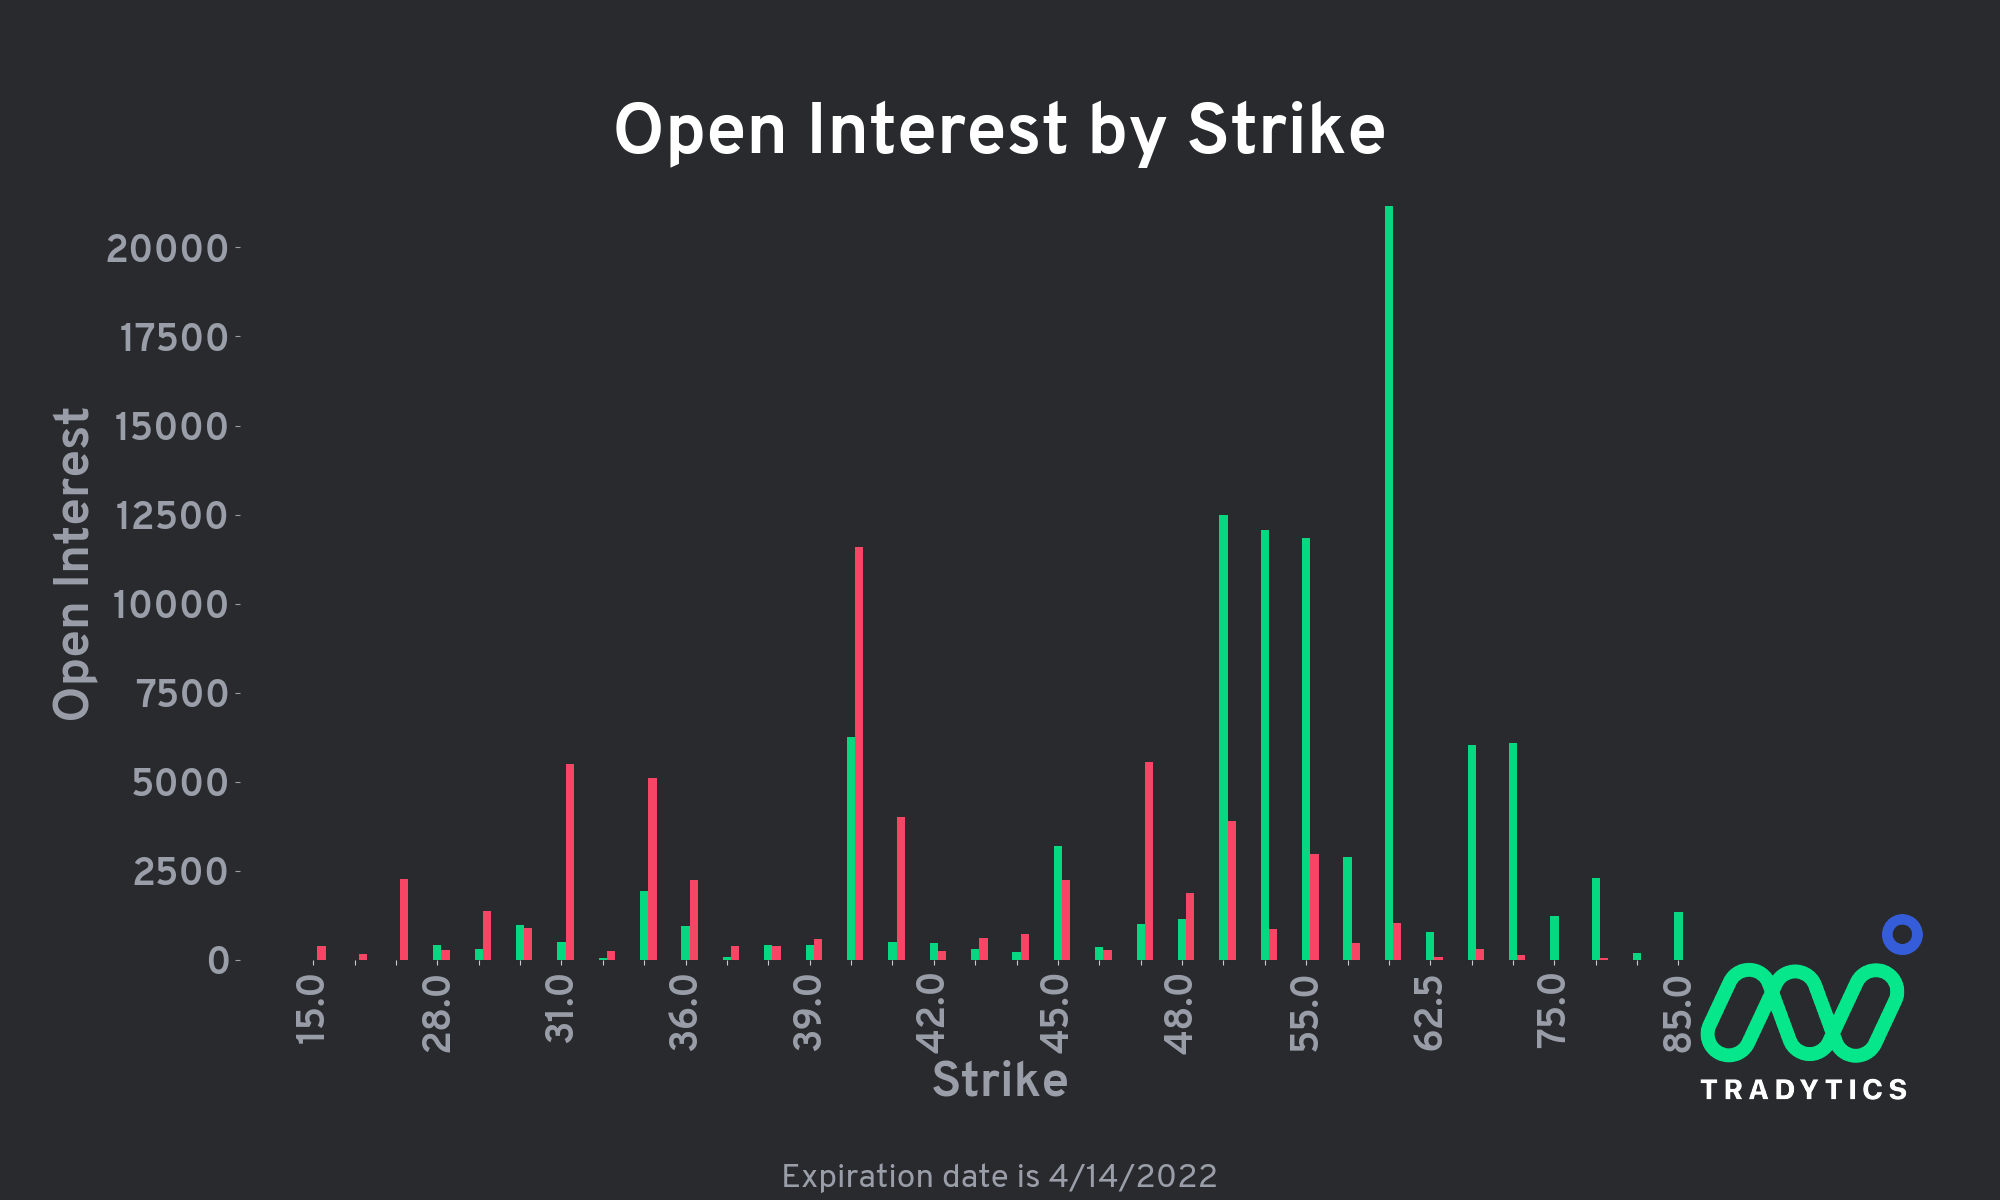
Tradytics $OXY flow analysis
From a flow point of view, the 60c for the 4/14 expiration has way more volume but is also a lot more expensive, so the 60c 4/14 would also a possible trade.
$AAPL 4/14 170c > 164.48
Back on my list, $AAPL long, keep in mind that I’m an Apple perma-bull :-)
Idea here is the 2d green last week above 164.48 for a 2d-2u Bullish Reversal Weekly, 164.69 turns the month green into FTFC up.
The targets are 165.02 and 168.91 for now. With 4 weeks expiration on that contract the 170c might be in the tank.

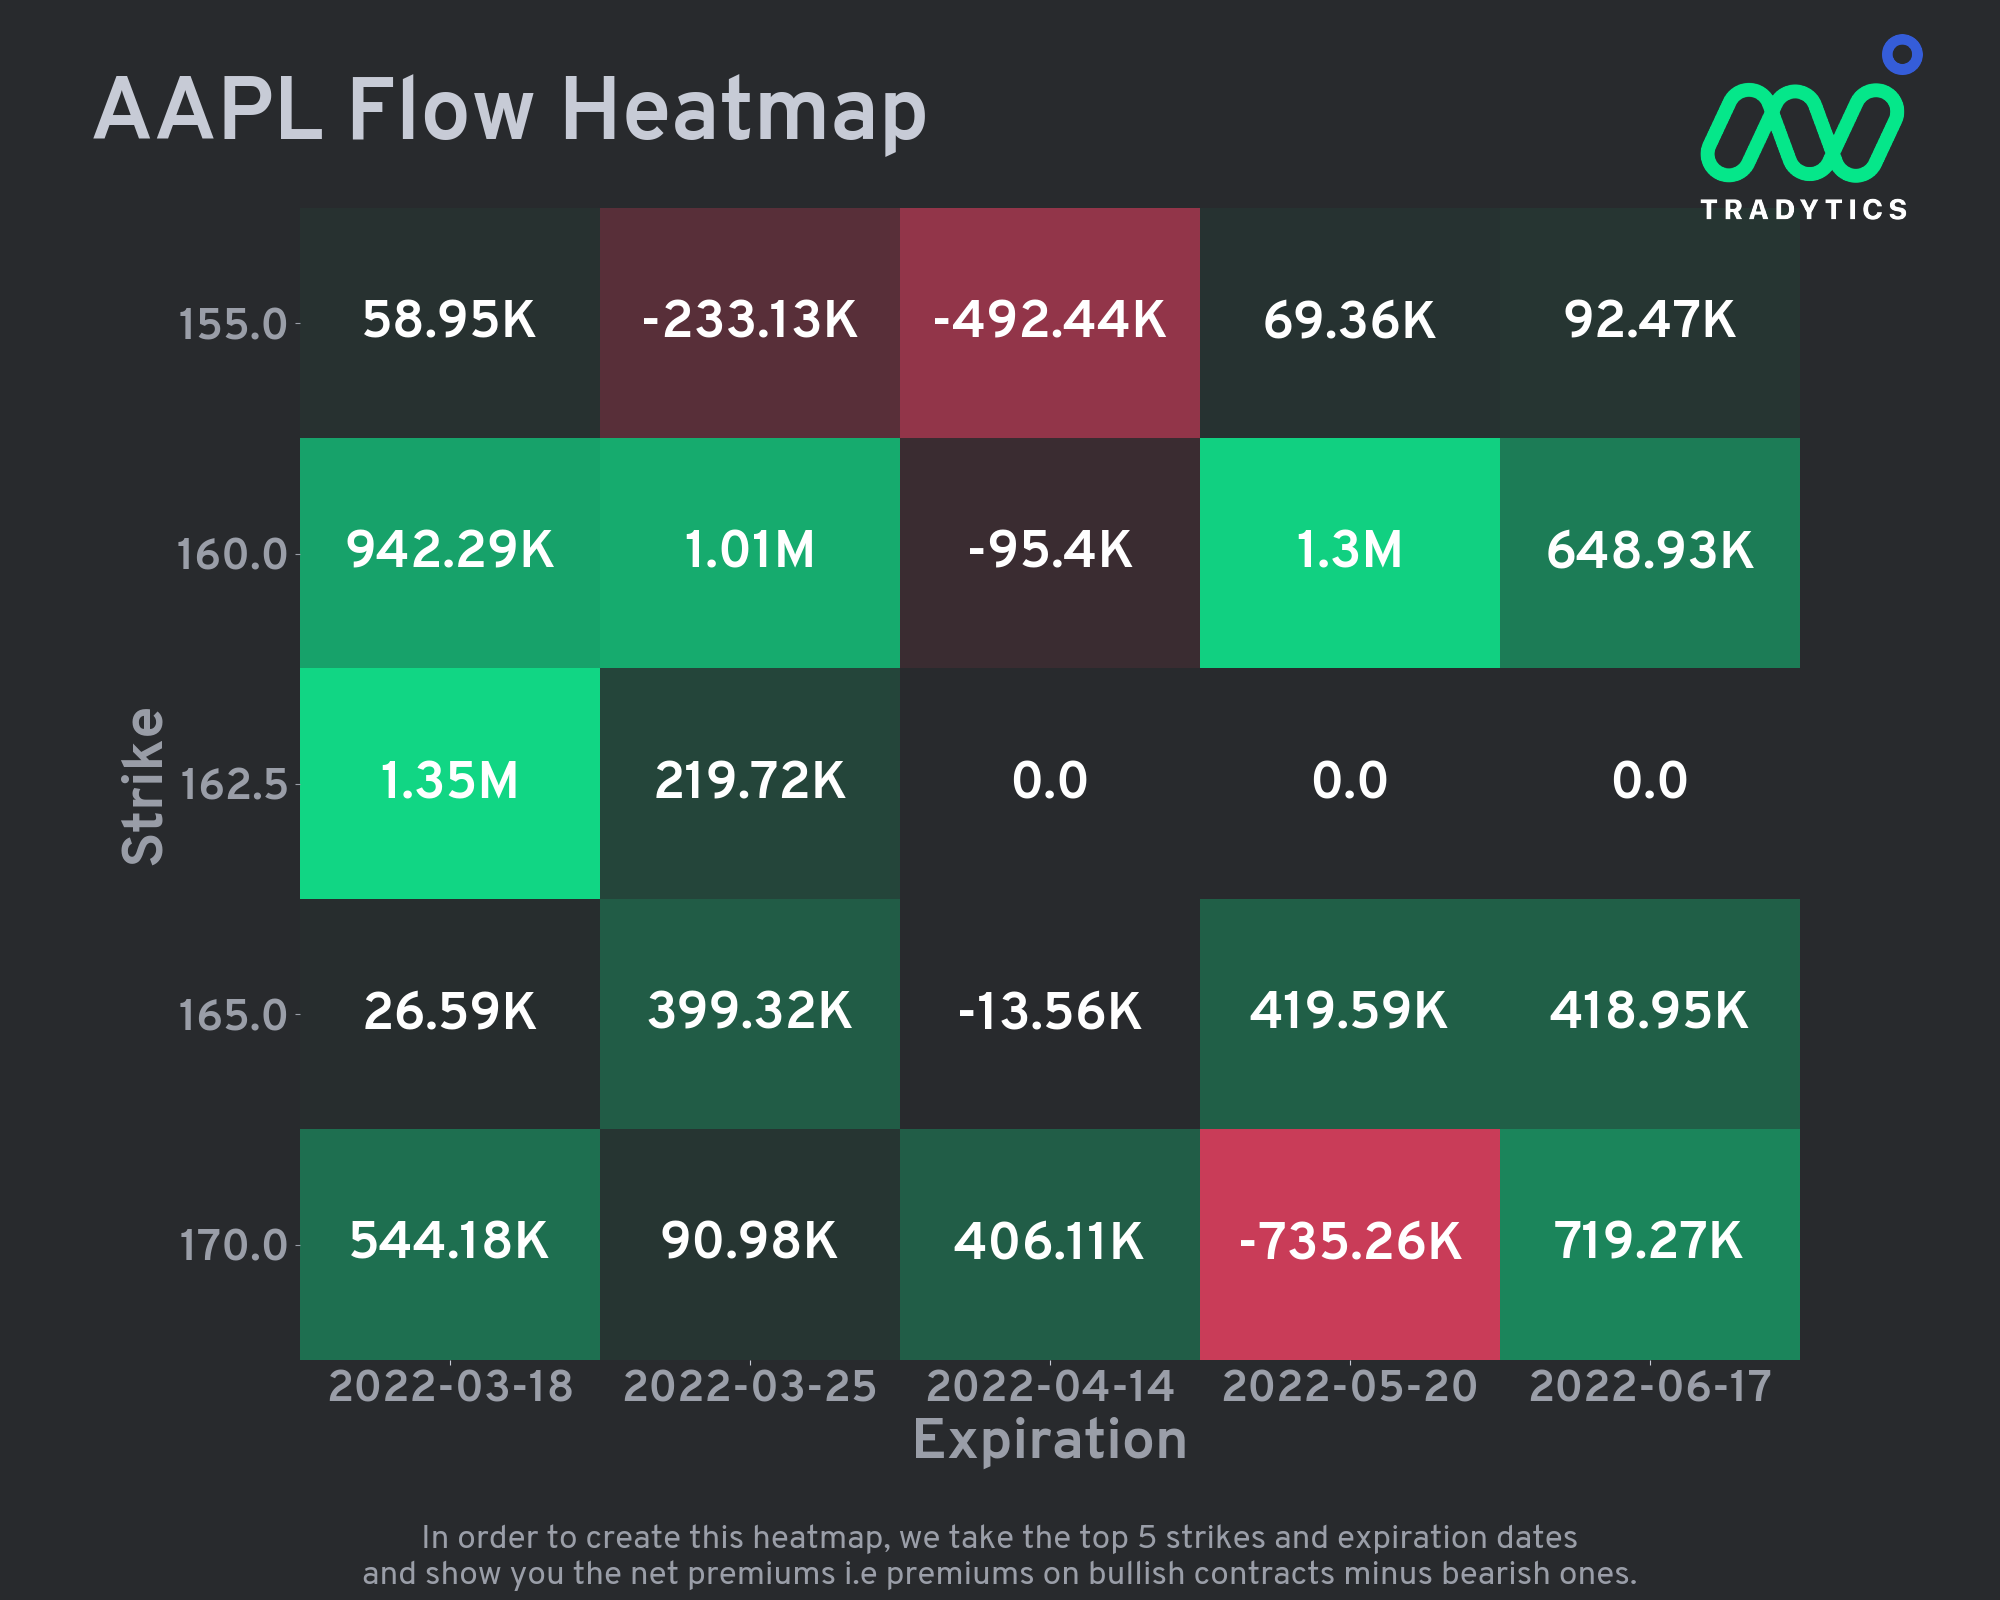
Tradytics $AAPL flow analysis
Since $AAPL has a large amount of flow the Open Interest map give no clear view to me, Algo flow on Tradytics is slightly bullish and the heatmap looks good for the 4/14 expiration.
With that — thanks for reading!
Have a nice green successful week!