My #SundaySwing ideas for the week of 2/28 based on #TheStrat
While all Puts from last weeks #SundaySwing issue had(!) worked great, that gap downs made it difficult to get in after the news.
And since I don’t know what we expect into next week, it’s difficult to select the proper swing ideas.
There are lots of weekly 2d green hammer setups, but due to the market volatility nothing is guaranteed.
We have a new month starting on Tuesday, so a new monthly candle and I expect a lot of inside months because of the huge February candles we had, so Tuesday will be the day where we really look at, let them open!
You can also subscribe to my Newsletter, to get the #SundaySwing issues right into your inbox when I publish them.
TLDR;
Still sticking to the 3/18 expiration (one exception), 3 weeks time for this to play out. wearing my bull-pants again if we keep running, still cautious if this was not a dead-cat-bounce
- $AAPL 3/18 172.5c > 166.69
- $BA 3/18 230c > 206.90
- $GM 3/18 50c > 48.29
- $T 4/14 25c > 24.11
Recap of 2/20 SundaySwing
As stated above, market dropped down hard and all puts came into play, however the gaps made it difficult to enter.
On $NCLH and $PTON I could take good profits, while I didn’t traded $BABA. The only bullish setup $PG didn’t even came close to it’s trigger.
From the 2/7 #SundaySwing ideas, $X 3/18 25c worked great as well.
Disclaimer: Not advice, instead these are my ideas based on my knowledge analyzing the charts for possible swing trades based on #TheStrat. So please always do your own due diligence before entering a trade.
Chart setups
Since I got always questions about the colors in my charts and the setups:
- I always chart in multiple time frames Monthly, Weekly, Daily, and 4-hour or 60min
- Purple lines last months high&low
- Orange lines last weeks high&low
- Blueish lines last day high&low
- Green lines are my targets
- Sometimes white and yellow for intermediate targets or 50% rule setups
- The brownish-boxes on the Daily and 4-hour chart you see sometimes show a gap that hasn’t filled yet.
If some of the broadening formation lines looking a bit curved, it is because I switched to logarithmic scale on the charts, but they are still correct.
Outlook
As always lets have a look at $SPY and $QQQ for a rough prediction of what I think the market will do next. Or course it’s just my interpretation, so keep that in mind!
$SPY

Last week was crazy and nearly all setups I have this week, looking nearly the same on the weekly chart. Hammers counters shooter, which is often a great bullish actionable signal.
If $SPY triggers week above 437.75, it could target 448.05 next, with intermediate targets on the daily of 438.66, 443.80.
$QQQ

Like $SPY, looks bullish with intermediate Daily targets at 346.81, 353.46.
If you look at that weekly green 2d candle, if we really reverse down again, I don’t see a 2d weekly happen, that would be 318.26 has to be taken out.
Profits and Stops
I usually target around 25-40% of profits on those swings and decide during the market hours if I leave a runner on a position or close the entire one.
To view the charts in full detail, click to open them in a new browser window.
Still on the March 18th expiration this time, not that much time as normally, but due to the high volatility and market is still not a bull market again, for me I look at closer expiration.
However, I looked up the 4/14 expiration on some of the ideas and if you look at the monthly candles, that expiration with a slightly more OTM strike is also an option.
$AAPL 3/18 172.5c > 166.69
If you follow my ideas here, you know that I’m an Apple Fanboy and perma-bull, so as I saw that possible 2d-2u Bullish Reversal Weekly above 166.69 I had to place it on my list this week.
The month is 2d and red, so it will take a lot of work for the bulls to bring this back up, but on Tuesday new month and if it runs we have FTFC up if week triggers and keeps going.
My target is 173.34 which should be doable with the 3/18 expiration, if we going up!

$BA 3/18 230c > 206.90
Hammer counters shooter and a small gap on the weekly chart. Massive Doji-style candle on the month, with good chances to go green and continue in March.
If $BA triggers above 206.90 it is a nice 1-2-2u RevStrat Weekly combo with the targets of 219.68 and 223.23. Above 223.23 in March would trigger the 3-1-2u Bullish RevStrat Month.

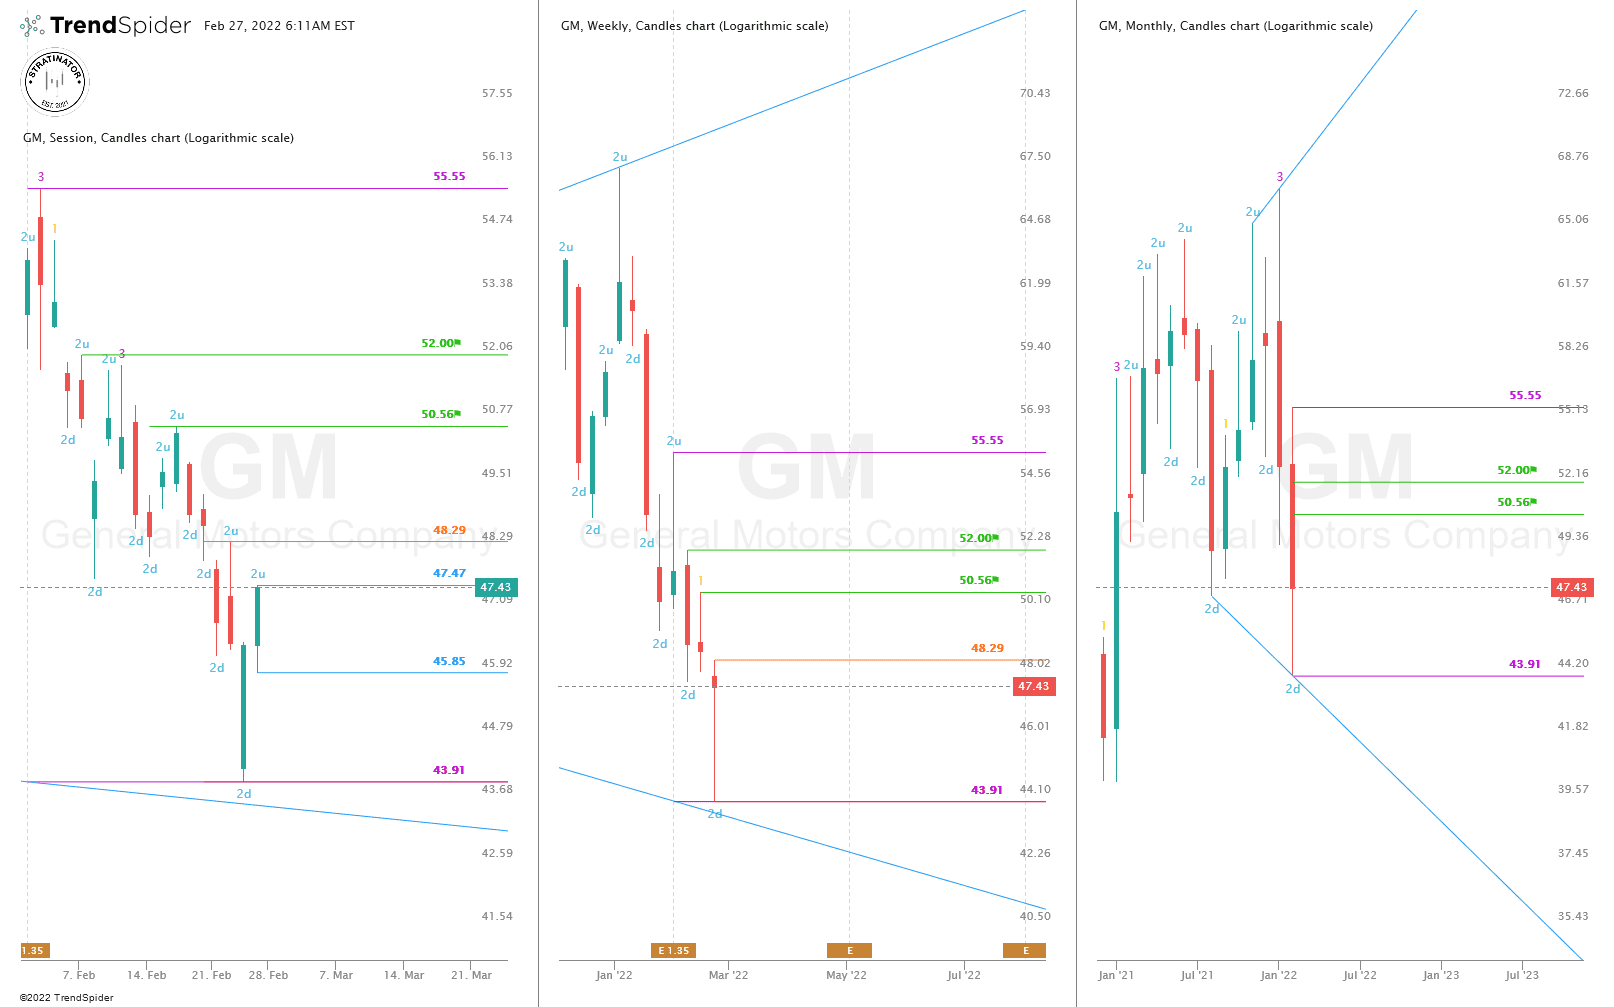
$GM 3/18 50c > 48.29
Slow mover that was taken down as well, but the 1-2-2u Bullish RevStrat Weekly is my idea here as well. Above 48.29 the targets are 50.56 and 52.00. I selected the 3/18 expiration, but the 4/14 expiration with the 52.5c or 55c would also be an option.
Month is 2d and red and needs 55.55 in March to trigger a 3-2-2u Bullish RevStrat, so if you go further OTM, 4/14 would be my expiration for this.
$T 4/14 25c > 24.11
A new one on my #SundaySwing ideas, AT&T, slow mover and the only one this week with the April expiration. The contracts are pretty cheap and the 25c is a valid ITM target at that date.
Idea is the 2-2u Bullish Reversal Weekly above 24.11, with targets at 24.45, 24.65 and 25.54.
At 24.91 in March it would trigger a 2-2u Monthly Bullish ReversaL which would target the 27.48. With the April expiration if it runs the 25c could be a good amount ITM. Keep in mind that $T is a really slow mover even in the current market!

With that — thanks for reading!
Have a nice green successful week!