Free #SundaySwing ideas week of 1/10 based on #TheStrat
Welcome to the first issue of my #SundaySwing ideas in 2022!
I wish you all a Happy New Year 2022!
As mentioned on Friday on Twitter already, the current short-term outlook to me is bearish in the tech sector, which I mainly focus on. So be prepared for some Put-ideas, more than usual.
The current market sentiment is pretty volatile to me, so instead of going with expiration into the February (2/18) expiration, which is what I had planned, I will post ideas for shorter swings with expiration still in January (1/21).
Next big tech earnings session is starting end of January into February, so the 1/21 expiration is another reason I don’t look at the 2/18 expiration yet.
Since the additional information on the ideas in the last issue in December with Tradytics* Data worked quite well, I will continue provide some extra information from that fantastic platform.
TLDR;
Bear mode!
- $QQQ 1/21 370p or 365p < 378.04
- $IWM 1/21 210p or 205p < 215.82
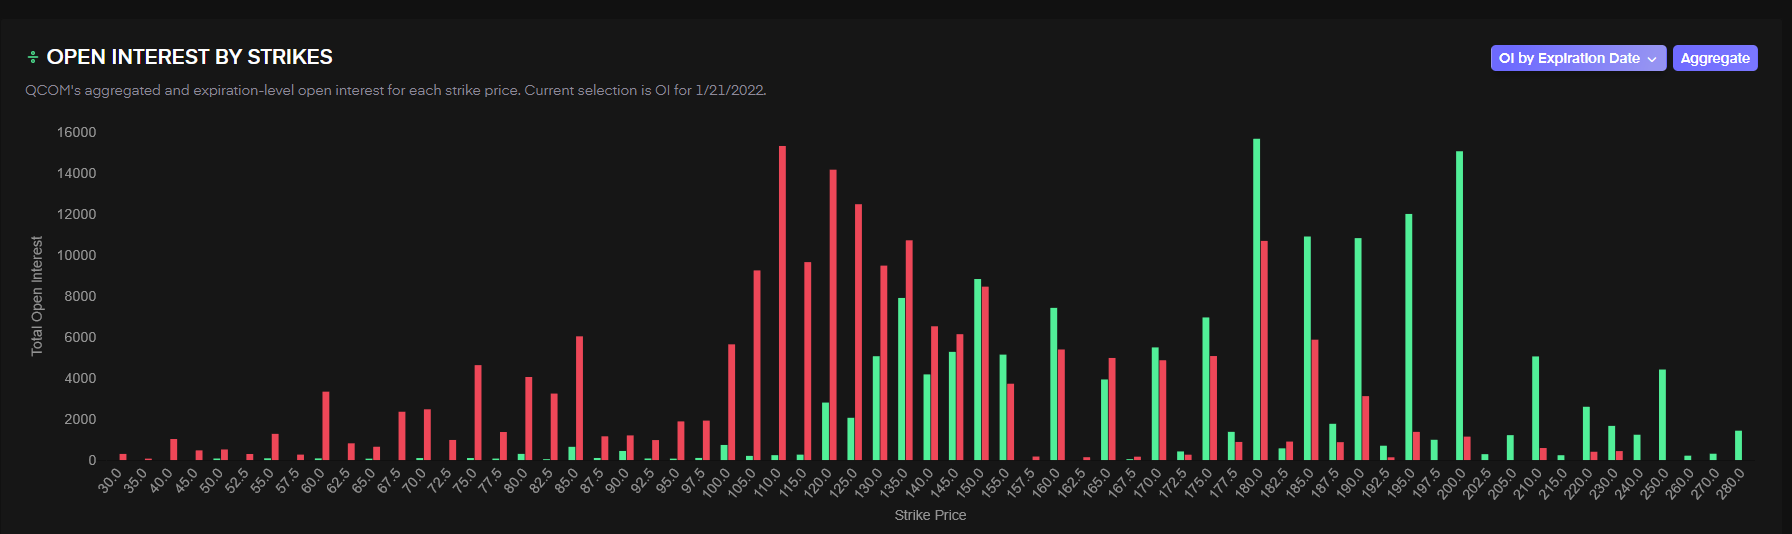
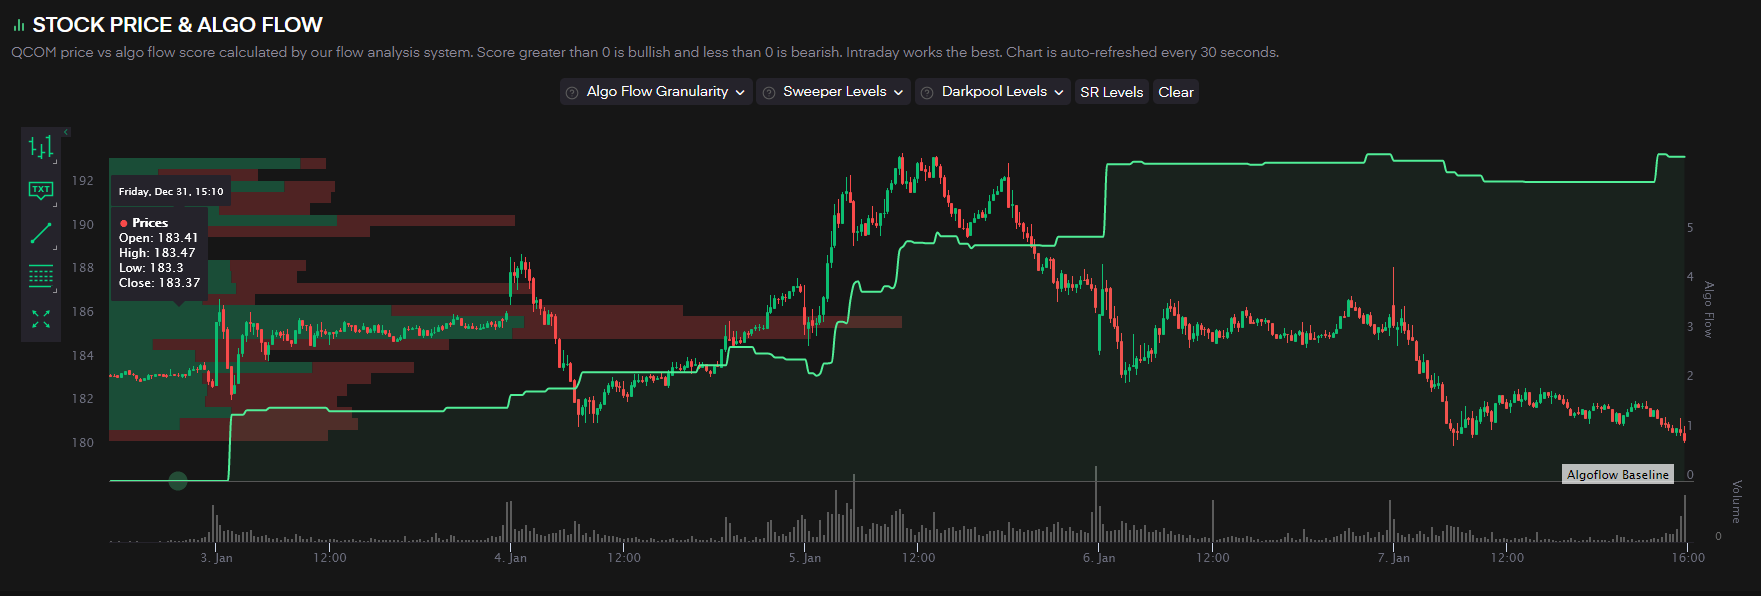
- $QCOM 1/21 175p or 170p < 180.12
- $XLE 1/21 62c or 63c > 61.50
Recap of 12/19 SundaySwing
It was a slight positive mix of triggers that worked great.
$ATVI & $UBER both triggered and already got ITM and hit the projected targets for me.
$ROKU did trigger the entry right in the week after my post, but failed the week after without making it to my first projected target.
$CLF triggered in the last week of December and hit all 3 projected targets last week.
Disclaimer: No advice, instead these are my ideas based on my knowledge analyzing the charts for possible swing trades based on #TheStrat. So please always do your own due diligence before entering a trade.
Chart setups
Since I got always questions about the colors in my charts and the setups:
- I always chart in multiple time frames Monthly, Weekly, Daily, and 4-hour or 60min
- Purple lines last months high&low
- Orange lines last weeks high&low
- Blueish lines last day high&low
- Green lines are my targets
- Sometimes white and yellow for intermediate targets or 50% rule setups
- The brownish-boxes on the Daily and 4-hour chart you see sometimes show a gap that hasn’t filled yet.
If some of the broadening formation lines looking a bit curved, it is because I switched to logarithmic scale on the charts, but they are still correct.
Outlook
As always lets have a look at $SPY and $QQQ for a rough prediction of what I think the market will do next. Or course it’s just my interpretation, so keep that in mind!
Flow info from Tradytics
As mentioned above I’m currently testing Tradytics for additional confirmation of my strikes. The link to Tradytics is a referral link, so if you find that service also helpful and want to try it for yourself, I would appreciate it, if you use that link to support me.
$SPY

I only see a slight chance of a reversal if we close on Monday or Tuesday at least in the 470-range. But more likely is a drop down, if you look at the monthly chart, 463.96 is the 50% Rule trigger to get a possible outside month. The target for this would be 448.92, which sounds a bit unbelievable, but the Rule is more often correct than fails.
I also painted a micro-tri on the 60min chart (bottom right), with a slight “hope” the we hit the bottom here and bounce back up.
$QQQ

QQQ is still an inside month, but to be honest, how high is the chance the we will not reach 377.47 and instead bounce back up. If we see a close above 385 next week I might switch to bull-mode again, but for now, this looks bearish and the next targets are down in the 350-360 area for me if we drop down through the weekly first broadening formation I’Ve drawn.
I have selected QQQ as one of my ideas this week, so have a look down below for possible targets.
Profits and Stops
I usually target around 25-40% of profits on those swings and decide during the market hours if I leave a runner on a position or close the entire one.
Swing ideas
Would love to get some feedback about this format here and if this helps you learn #TheStrat, as well as I’m open for any things that will help more.
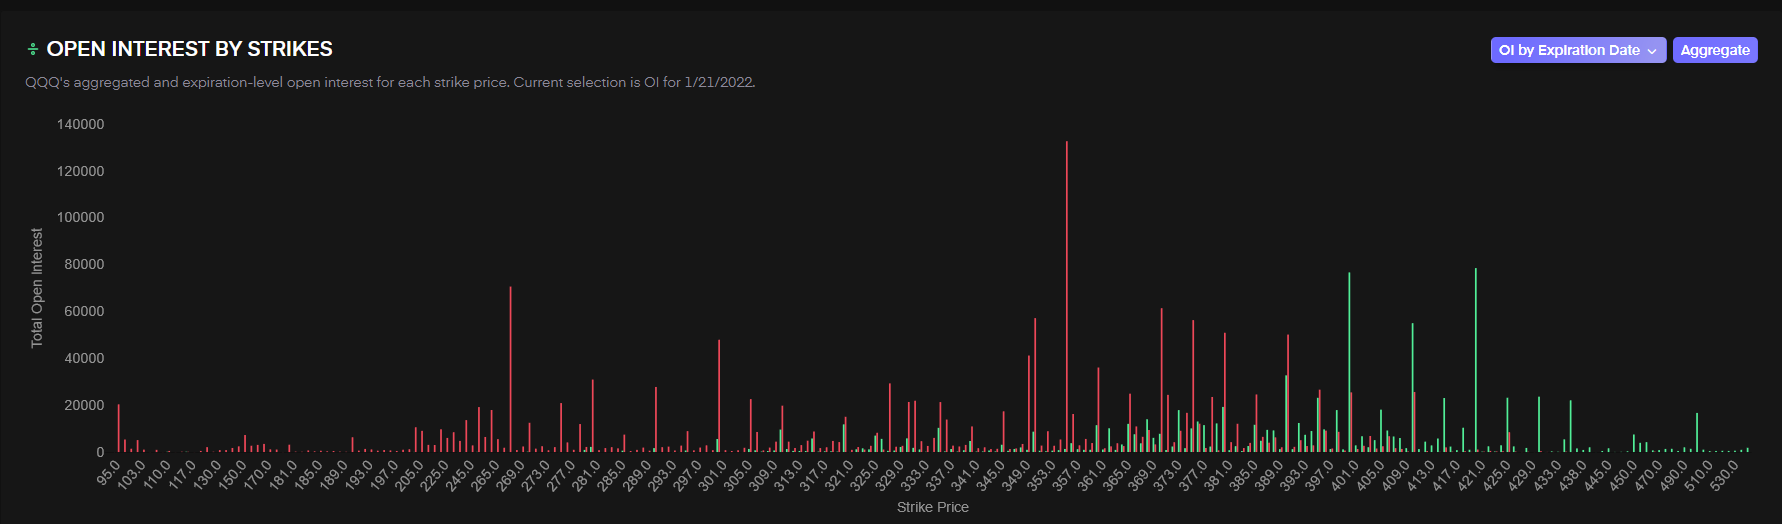
$QQQ 1/21 370p or 365p < 378.04
As mentioned above, $QQQ is new entry in my #SundaySwing ideas. So we will see how index ideas play out at the end.
A break of 378.04 would trigger a 2-2d Weekly Bearish Reversal with a target of 373.56. Also that number might sound familiar, because it’s another trigger of the 2-2d Monthly Bearish Reversal with a pessimistic target at 350.32. I picked one intermediate target at 366.99 which sounds more realistic to me currently.
Therefore the 370p or 365p for 1/21 would be my idea here.

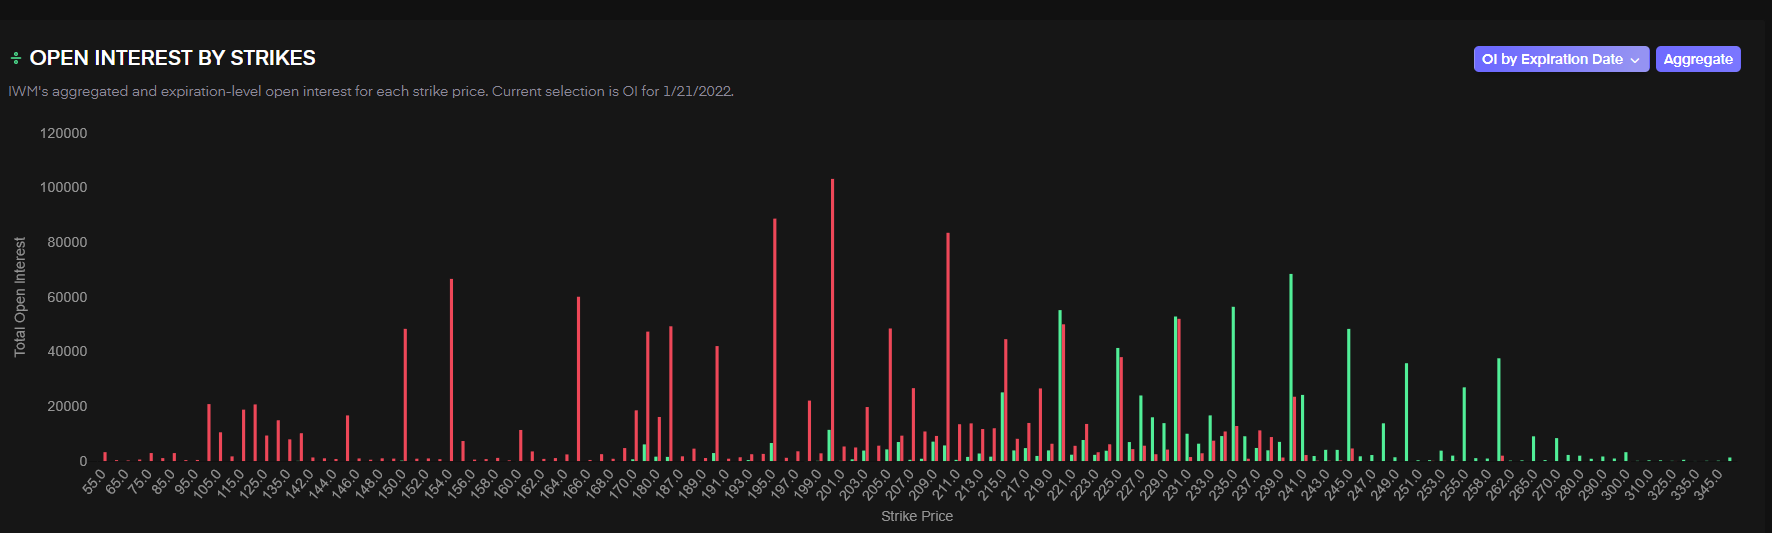
$IWM 1/21 210p or 205p < 215.82
Another index and look at this chart, every last candle is a shooter-type of candle with nearly no lower wick. As you might see on the Monthly, the 50% Rule trigger was already activated at 217.65 and now the target is an outside month at 208.76. So if $IWM triggers my entry below 215.82 next week a 3-2d with a target of 210.30 is the one I’m aiming for and after that the monthly 208.76. The extra 205.76 is the low of February 2021, to show in which regions we’re trading here.
I don’t need to mention that we have FTFC down, if you look at this chart.

QCOM 1/21 175p or 170p < 180.12
Look at the chart below and tell me you see some bullish signals there? Shooter on the month, week and big red 2d on Friday. My entry would be the 3-2d on the weekly below 180.12 with a first target at 173.46. 171.21 is last months low and would trigger an outside month, where my next target would be 165.81. If you also look at the monthly chart, $QCOM is below the 50% Rule of 181.94 and therefore has a high chance to go outside month.

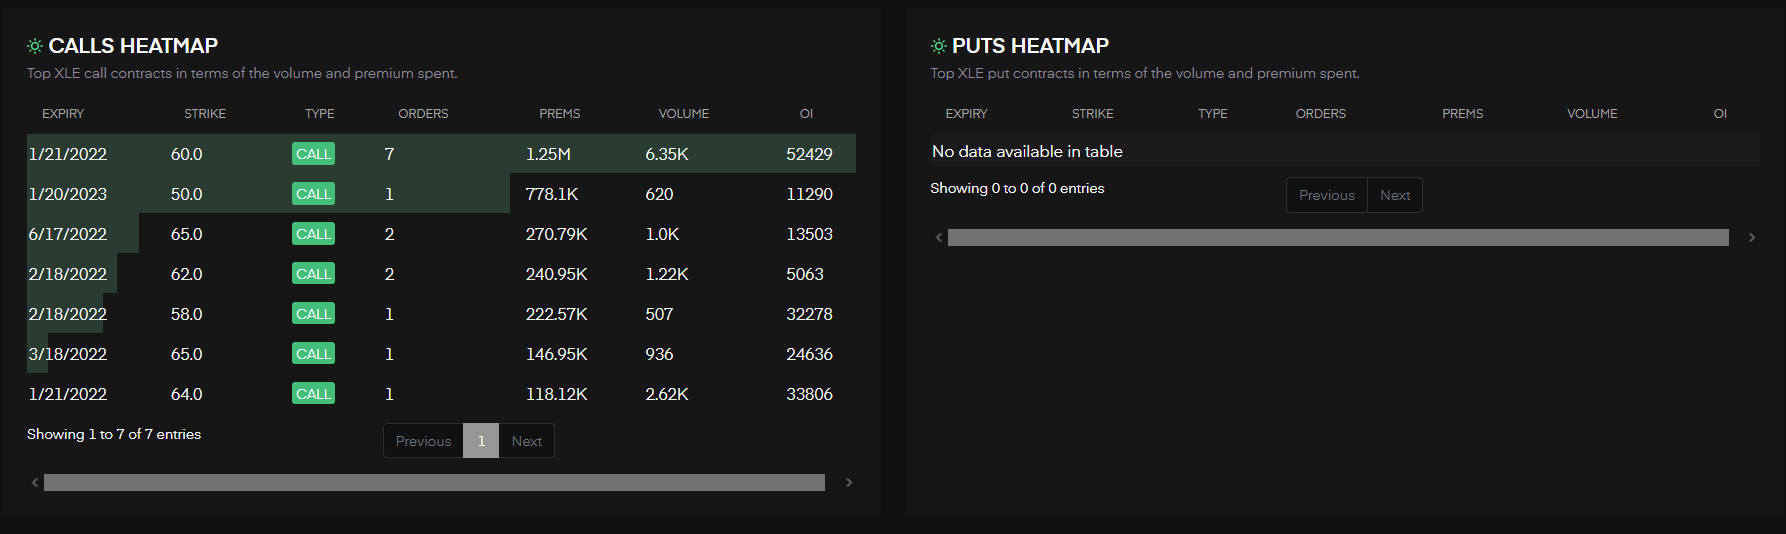
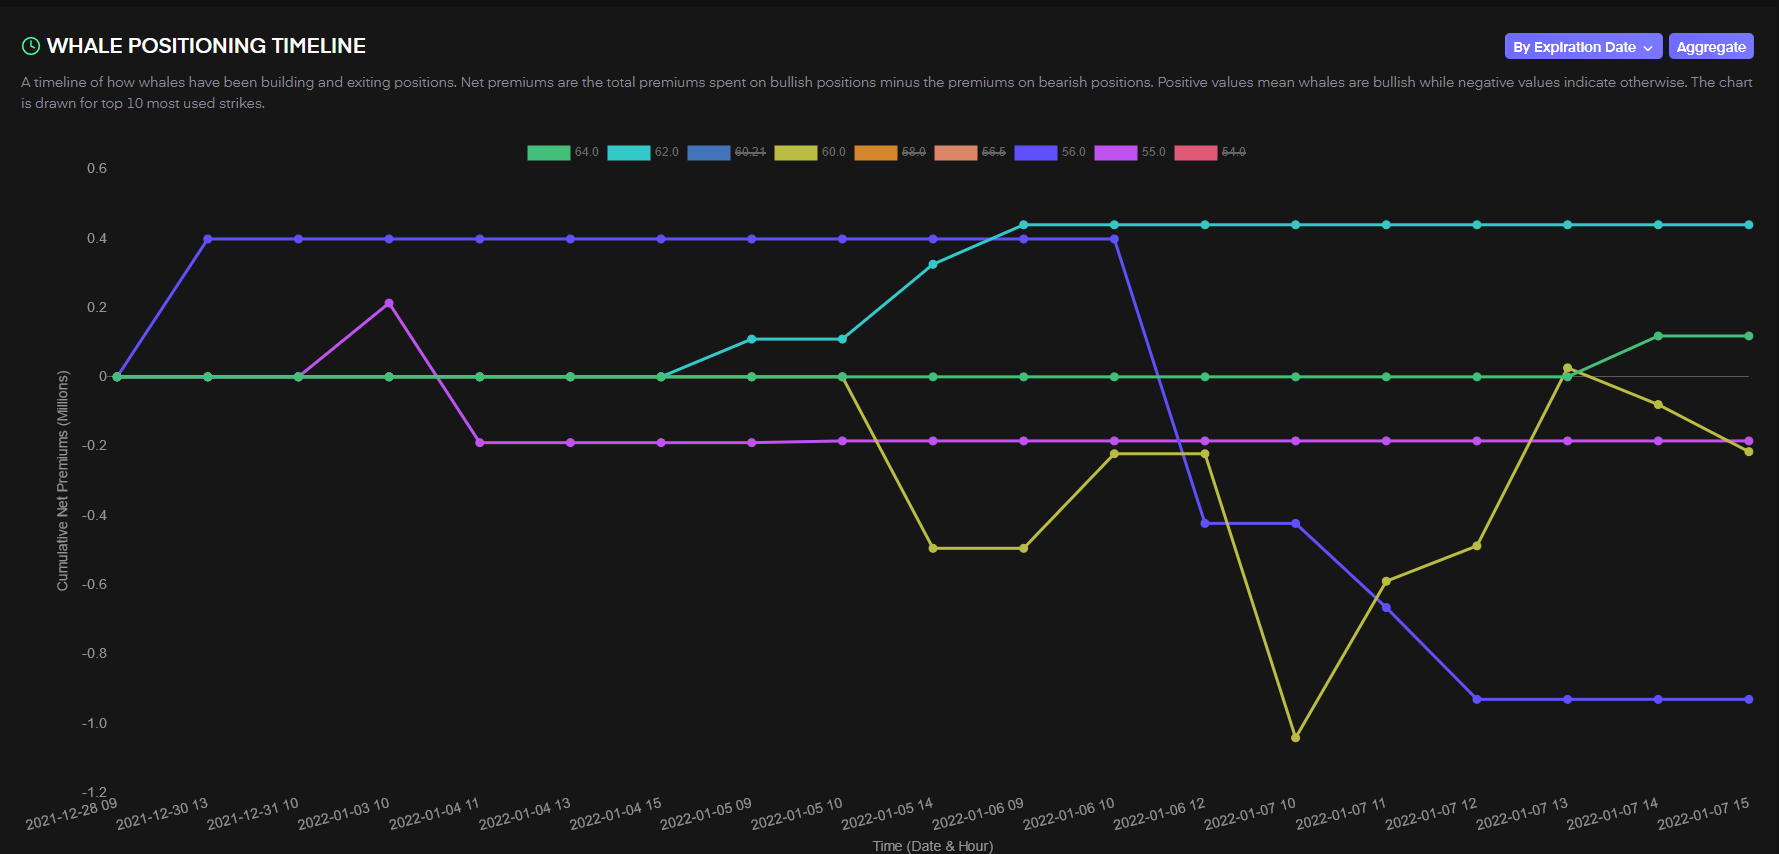
$XLE 1/21 62c or 63c > 61.50
I can’t finish this issue with a bearish idea, so Energy is the strong sector currently and I think this will continue. So I picked $XLE index a another idea. The chart shows FTFC up and the next targets above 61.50 the trigger for the 2-2 Weekly Continuation are back from December 2019 62.44 and 63.65. I would like to see a daily reversal for an entry into that trade, so even if we trigger the 61.50 on Monday, I would eye on the daily closings and then enter when XLE reverses back into FTFC.