Free #SundaySwing ideas week of 12/20 into January based on #TheStrat
My selection of #SundaySwing ideas into January expiration time based on #TheStrat
This week I’m trying something additional and show some option flows for the selected contracts to document why I’ve chosen it and if a #TheStrat and Flow combo could be a thing aka #FlowTrades. I currently test this with Tradytics* as a service and we’ll see how this plays out.
Also this will probably the last release of the swing ideas for this year. Holidays are near and I need to take some time off and want to spend as much time as possible with the family. New #SundaySwing ideas will be back beginning of 2022.
TLDR;
- $ATVI 1/21 65c > 62.06
- $UBER 1/21 45c > 40.00
- ROKU 1/21 300c > 237.18
- CLF 1/21 22c > 20.98
Recap of 12/12 SundaySwing
Last week was rough and many stocks dipped down heavy, so none of the selections ($DLTR, $DIS, $MU, $PINS) triggered for an entry. But I’m optimistic here and see it as a win, because with other TA signals there might be an entry. The Strat clearly denied an entry because no trigger was hit and therefore I lost no money.
Disclaimer: No advice, instead these are my ideas based on my knowledge analyzing the charts for possible swing trades based on #TheStrat. So please always do your own due diligence before entering a trade.
Chart setups
Since I got always questions about the colors in my charts and the setups:
- I always chart in multiple time frames Monthly, Weekly, Daily, and 4-hour or 60min
- Purple lines last months high&low
- Orange lines last weeks high&low
- Blueish lines last day high&low
- Green lines are my targets
- Sometimes white and yellow for intermediate targets or 50% rule setups
- The brownish-boxes on the Daily and 4-hour chart you see sometimes show a gap this isn’t filled yet.
Outlook
As always lets have a look at $SPY and $QQQ for a rough prediction of what I think the market will do next. Or course it’s just my interpretation, so keep that in mind!
Flow info from Tradytics
As mentioned above I’m currently testing Tradytics for additional confirmation of my strikes. The link to Tradytics is a referral link, so if you find that service also helpful and want to try it for yourself, I would appreciate it, if you use that link to support me.
SPY

I would like to see some bullish signal and a close above 464.74 on Monday or Tuesday. If SPY can close above this I still see 471-473 as next target for next week. If we not close below 460 on Monday or Tuesday 454-area is my target on the bearish side.
QQQ

Double inside week close. That is a rare thing on the QQQ. The last time it happened was in August 2019! However we closed inside and red and have FTFC down, like SPY. I would like to see a close above 390 on Monday or Tuesday for a bullish outlook and targets around 400 end of year. If QQQ dips down more with a close below 385 on Monday or Tuesday my targets on to the downside are 378/379.
Options and Expiration
As mentioned above and in my post of October results shown, I go at least 3-4 weeks (1/21 is currently my preferred one) out with expiration on options and not to far OTM if possible. I also trade on a small account and if an option is to expensive for my risk management, I simply don’t trade it. Because, profit is not guaranteed and everything can be lost on those options.
Profits and Stops
I usually target around 25-40% of profits on those swings and decide during the market hours if I leave a runner on a position or close the entire one.
Swing ideas
Would love to get some feedback about this format here and if this helps you learn #TheStrat, as well as I’m open for any things that will help more.
$ATVI 1/21 65c > 62.06
The only stock this week that I selected and is a continuation 1-2-2u play on the week. Normally reversals are easier but ATVI looks strong and held great against the market with 5 green days in a row. FTFC is up and at the bottom of my broadening formation. Above 62.06 my targets are 64.09, 65.64, 68.43. The 1/21 65c is a great deal if ATVI triggers that weekly level.

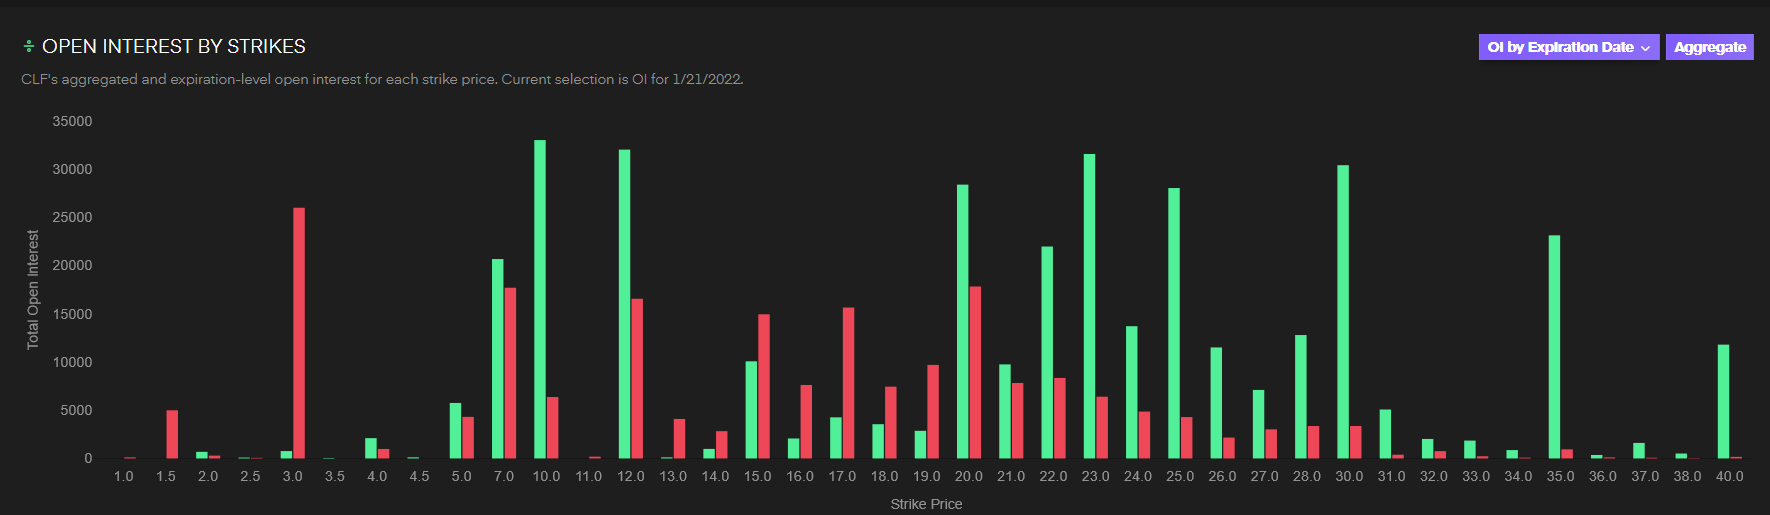
CLF 1/21 22c > 20.98
Except the month that is still red $CLF it would turn green into FTFC up if we trigger the 1-2-2u Weekly RevStrat above 20.98 (21.00) with the first target 21.67 (FTFC up!), 22.25, 23.28. The contract for 1/21 22c is surprisingly cheap and has lots of OI.

Tradytics has a bearish outlook but Strat-wise I’m bullish. Also look at the OI by strike for 1/21. Way more calls open than puts.
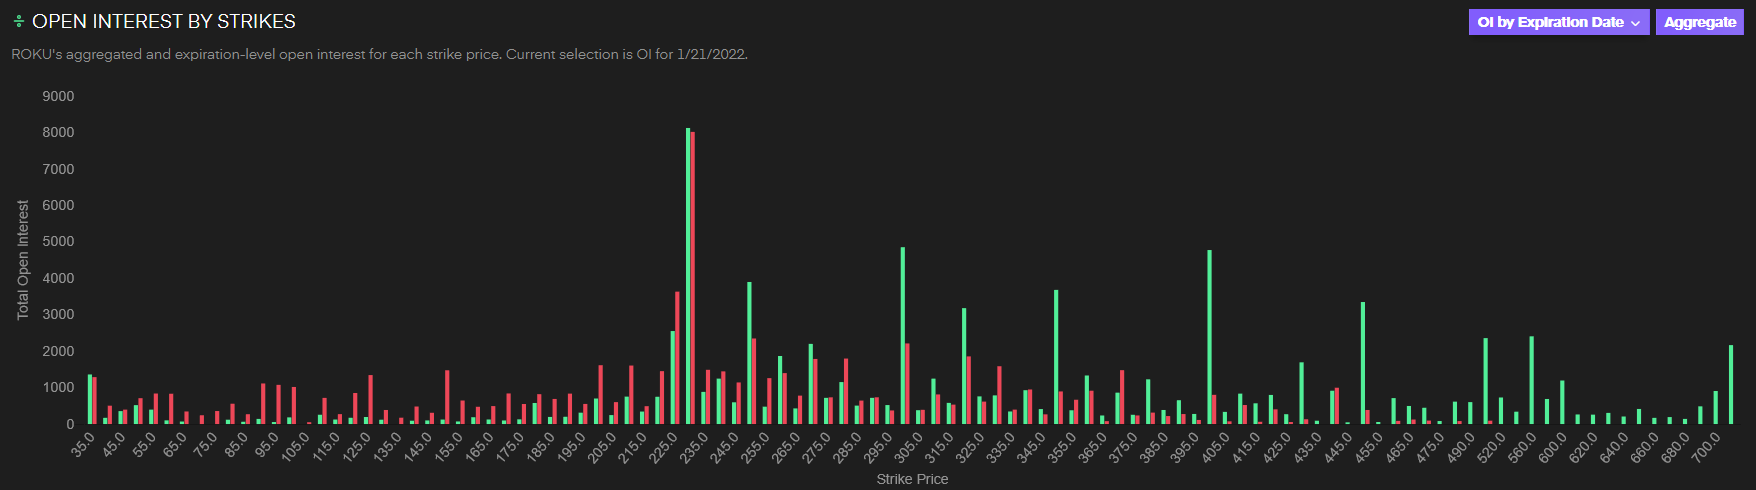
ROKU 1/21 300c > 237.18
The 3-2-2 Weekly Reversal is the strategy I’ve my eye on here. FTFC up and above 237.18 my target is 266.05 and 279.30 and maybe 285.63. I did not expect that the 300c goes ITM in 1/21, so I’m careful here. If I had the money I would play the 260c for 1/21 but that’s to expensive for me, that’s why I’ve my eyes on the 300c.

Bullish outlook on Tradytics as well, and confirms my above mention of the 300 strike that probably won’t go ITM, the 270c for 3/18 got lots of flow last week.
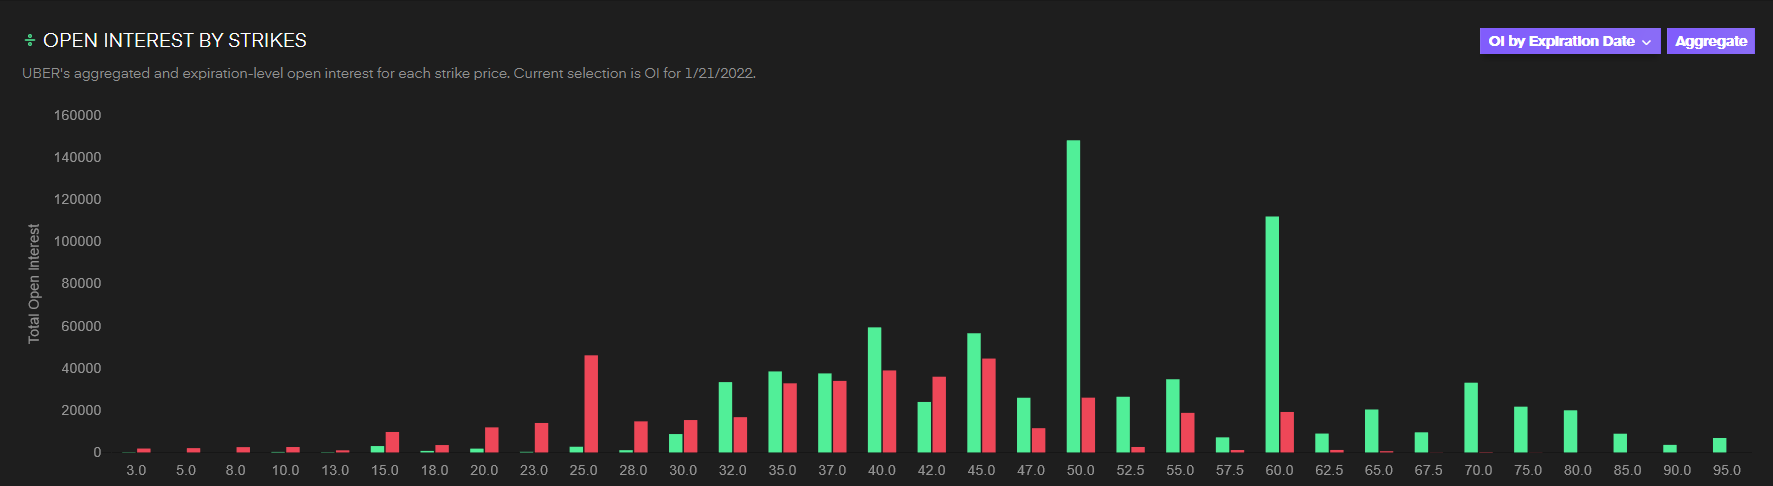
$UBER 1/21 45c > 40.00
Another 1-2-2u Weekly RevStrat setup with FTFC up. Above 40.00 my targets are 41.25, 44.40 and 46.66. So the 45c seems doable if the market moves in the same direction. Also the 45c has lots of volume and OI from last week.