$NQ_F July 2022 chart analysis and outlook - #ICT concepts
Good Morning,
trying something new this month/week, maybe not what you expected but most of you might have seen that I switched to ICT methods and futures trading during the last couple of months.
If you subscribed because of #TheStrat ideas and infos, I don’t think that I will and can provide them in the future, but if you’re interested in ICT and futures you can still be subscribed to my newsletter :-)
Starting this month I try to show my analysis of $NQ_F (Nasdaq 100 futures) for July, since that month started and we have the first week of the month.
Newsletter
If you want to read my observations and some other posts I write right in your email inbox, you can subscribe to my totally free Newsletter.
Learning
Keep in mind that I’m still new to the ICT concepts, I study them since November 2021 with the OTE series and switched over to the Mentorship 2022 Youtube playlist end of January. So this is all my observation and I can be completely wrong.
Also this is no signal service or anything like that, it’s really just my observation that I want to share with you.
Hint: The images can be clicked to open them in a larger view
Weekly July 3-9 outlook - NFP
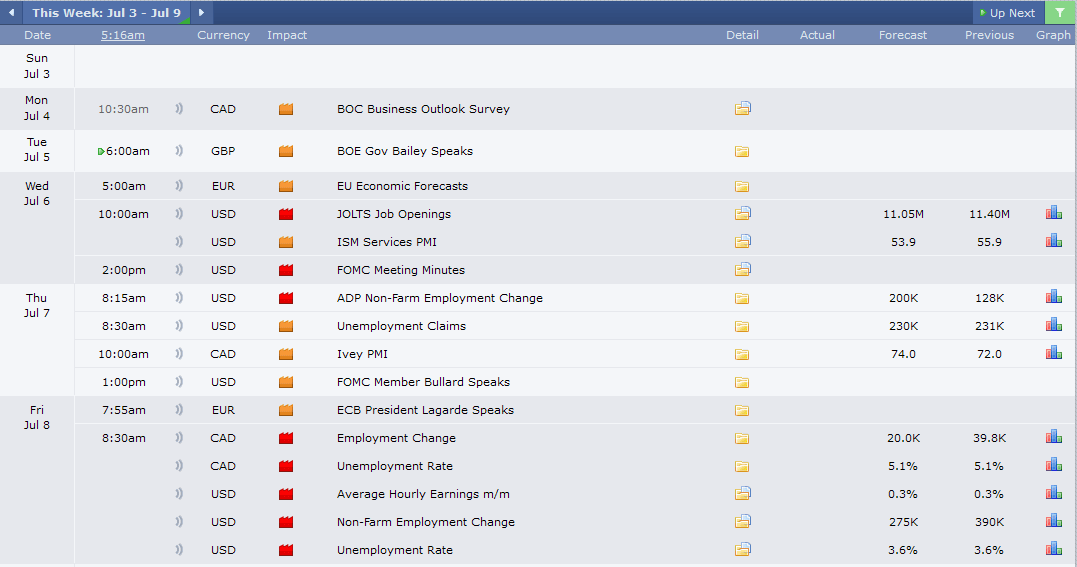
We have NFP week, so we might see some heavy manipulation on Wednesday and Friday and I will look and see how “they” open the week to get an idea of the possible July-candle.
Lots of volatility, here is this weeks calendar from forexfactory.com
Monthly chart
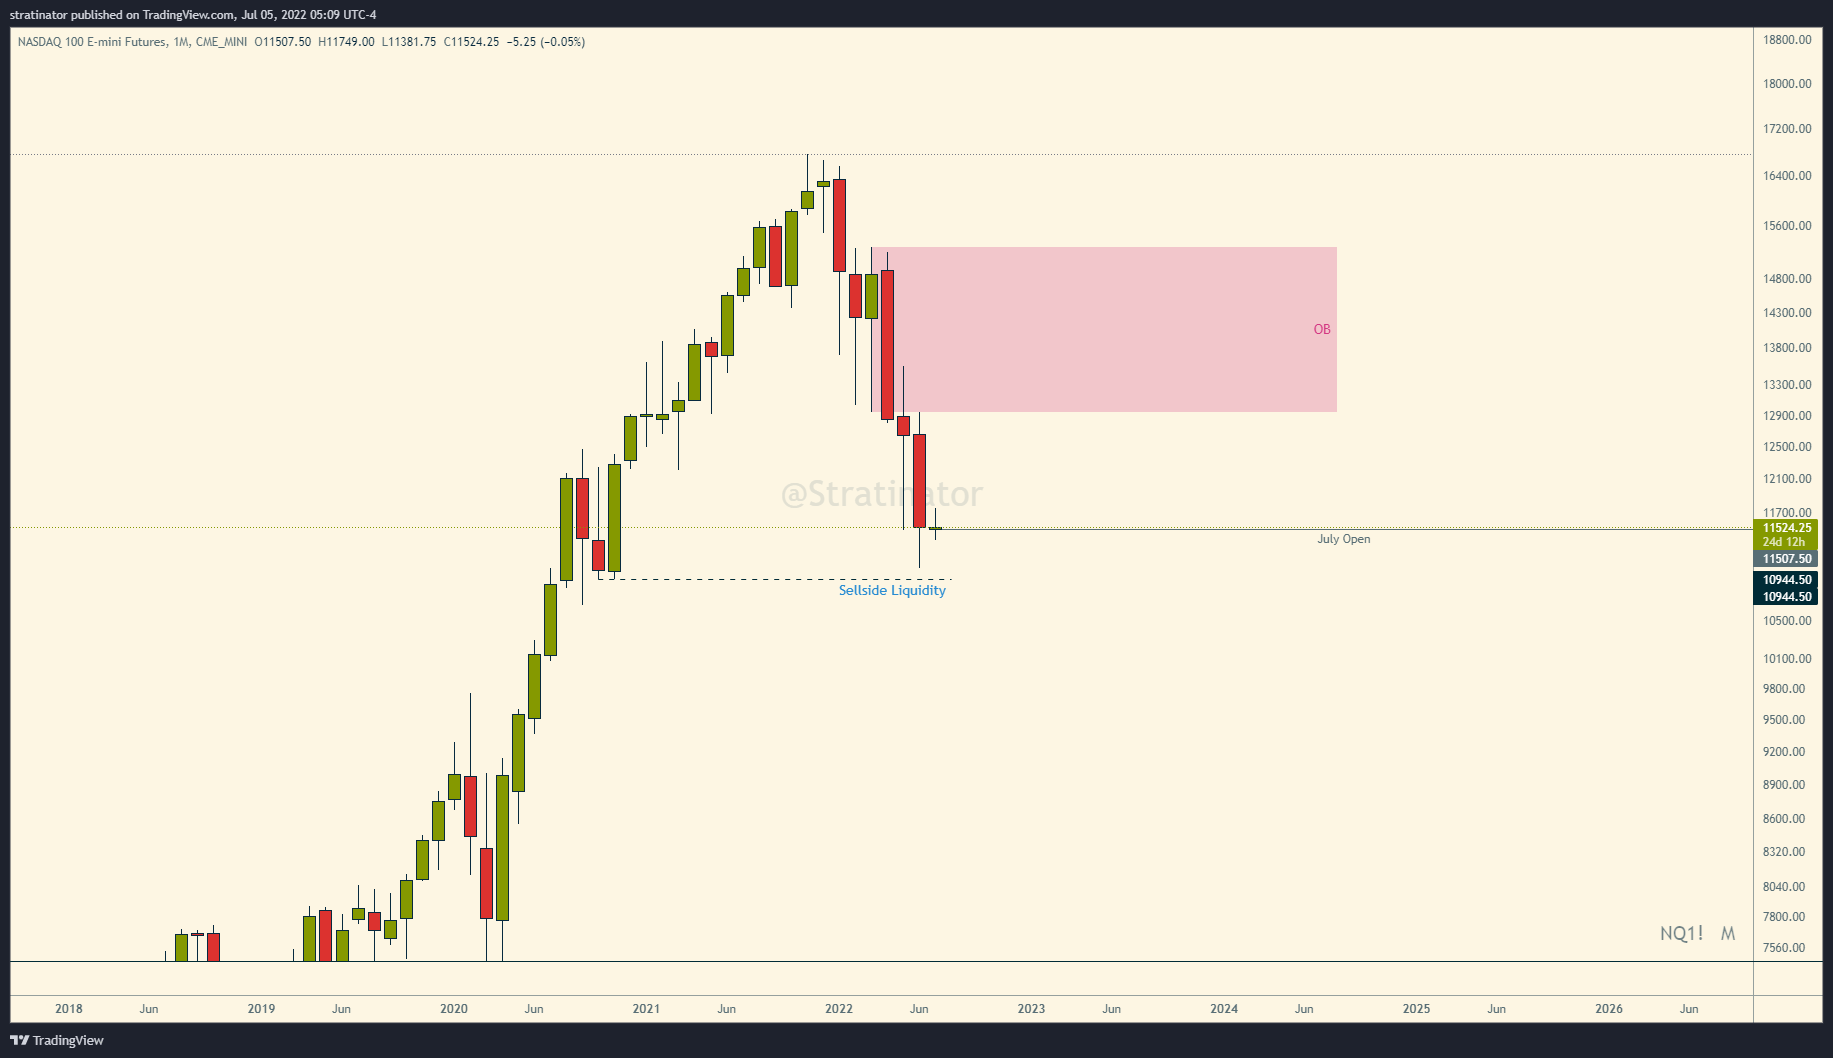
Staying bearish, rel. equal lows from October 2020 at 10944.50, as long as NQ trades below that Monthly OB I’m bearish longer term.
Weekly chart
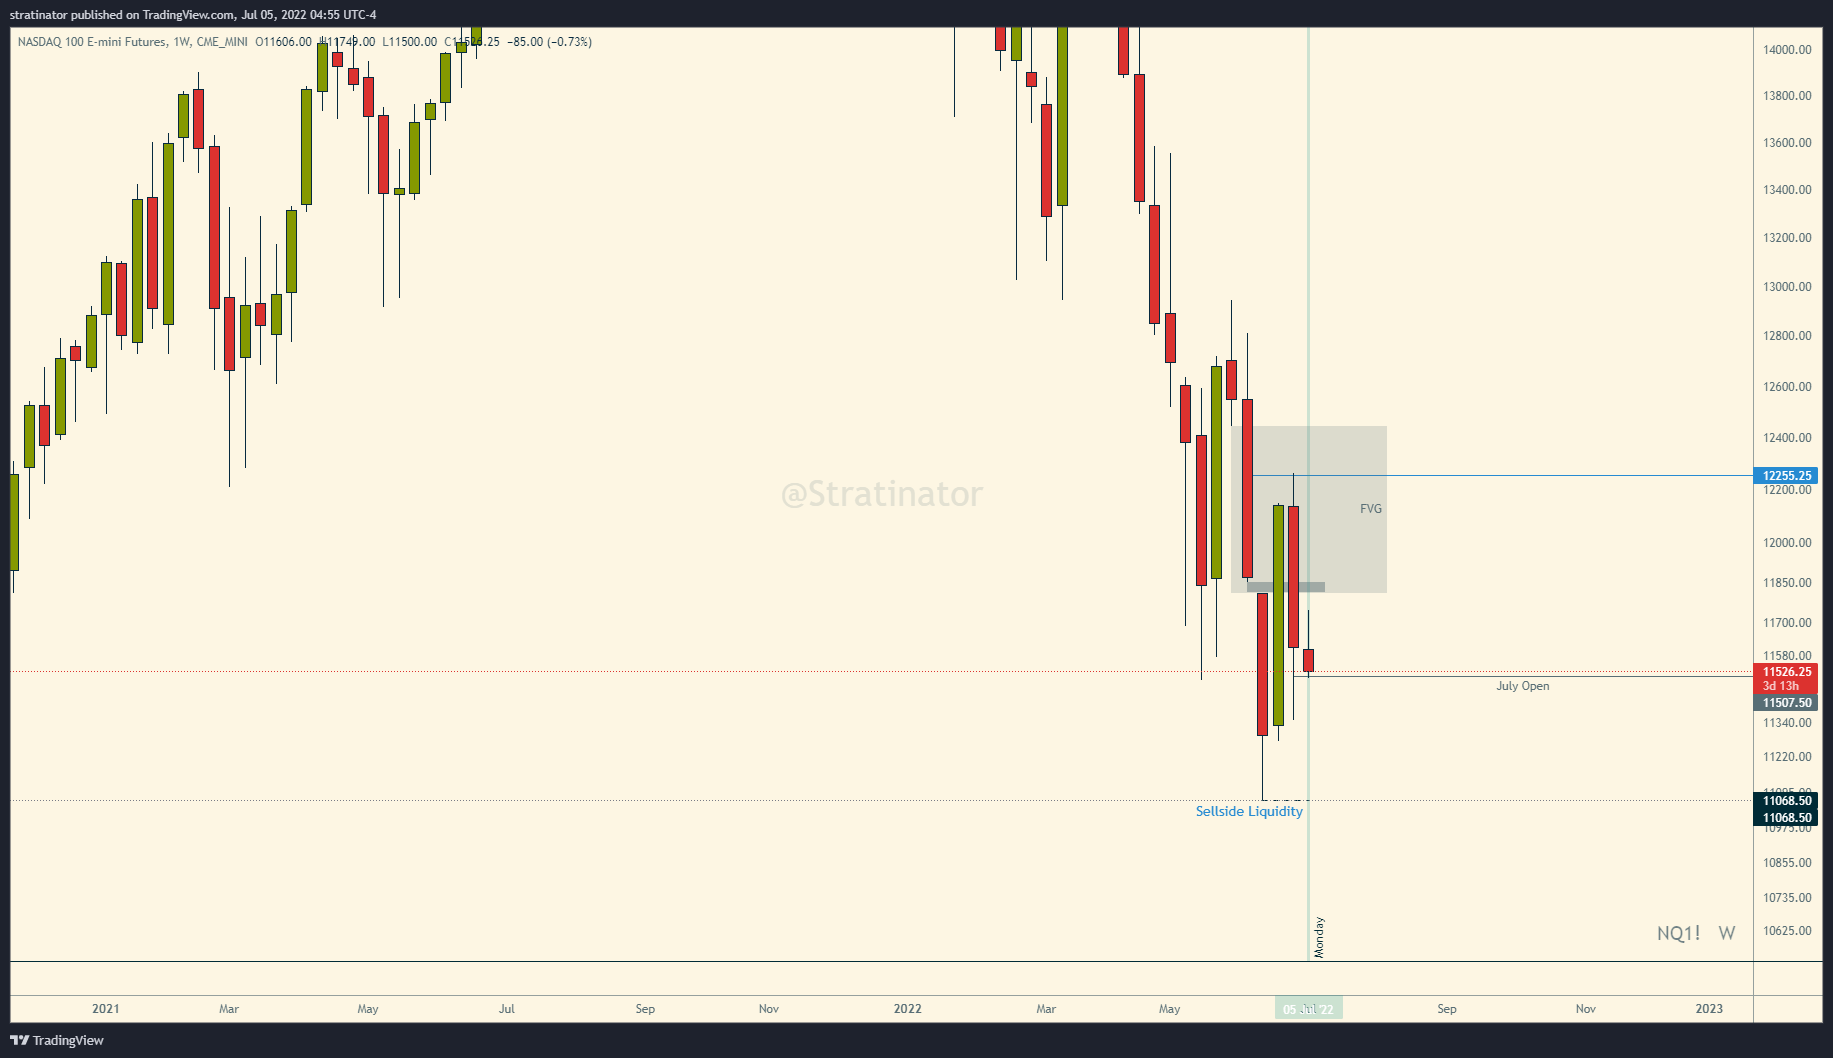
In a swing high downward direction, remember the 3rd->4th candle for a possible direction ICT mentioned in earlier videos. If price trades up to that little Gap at 11811 there might be resistance, or if it runs through could be later seen as possible support. But for now I’m bearish.
Daily chart
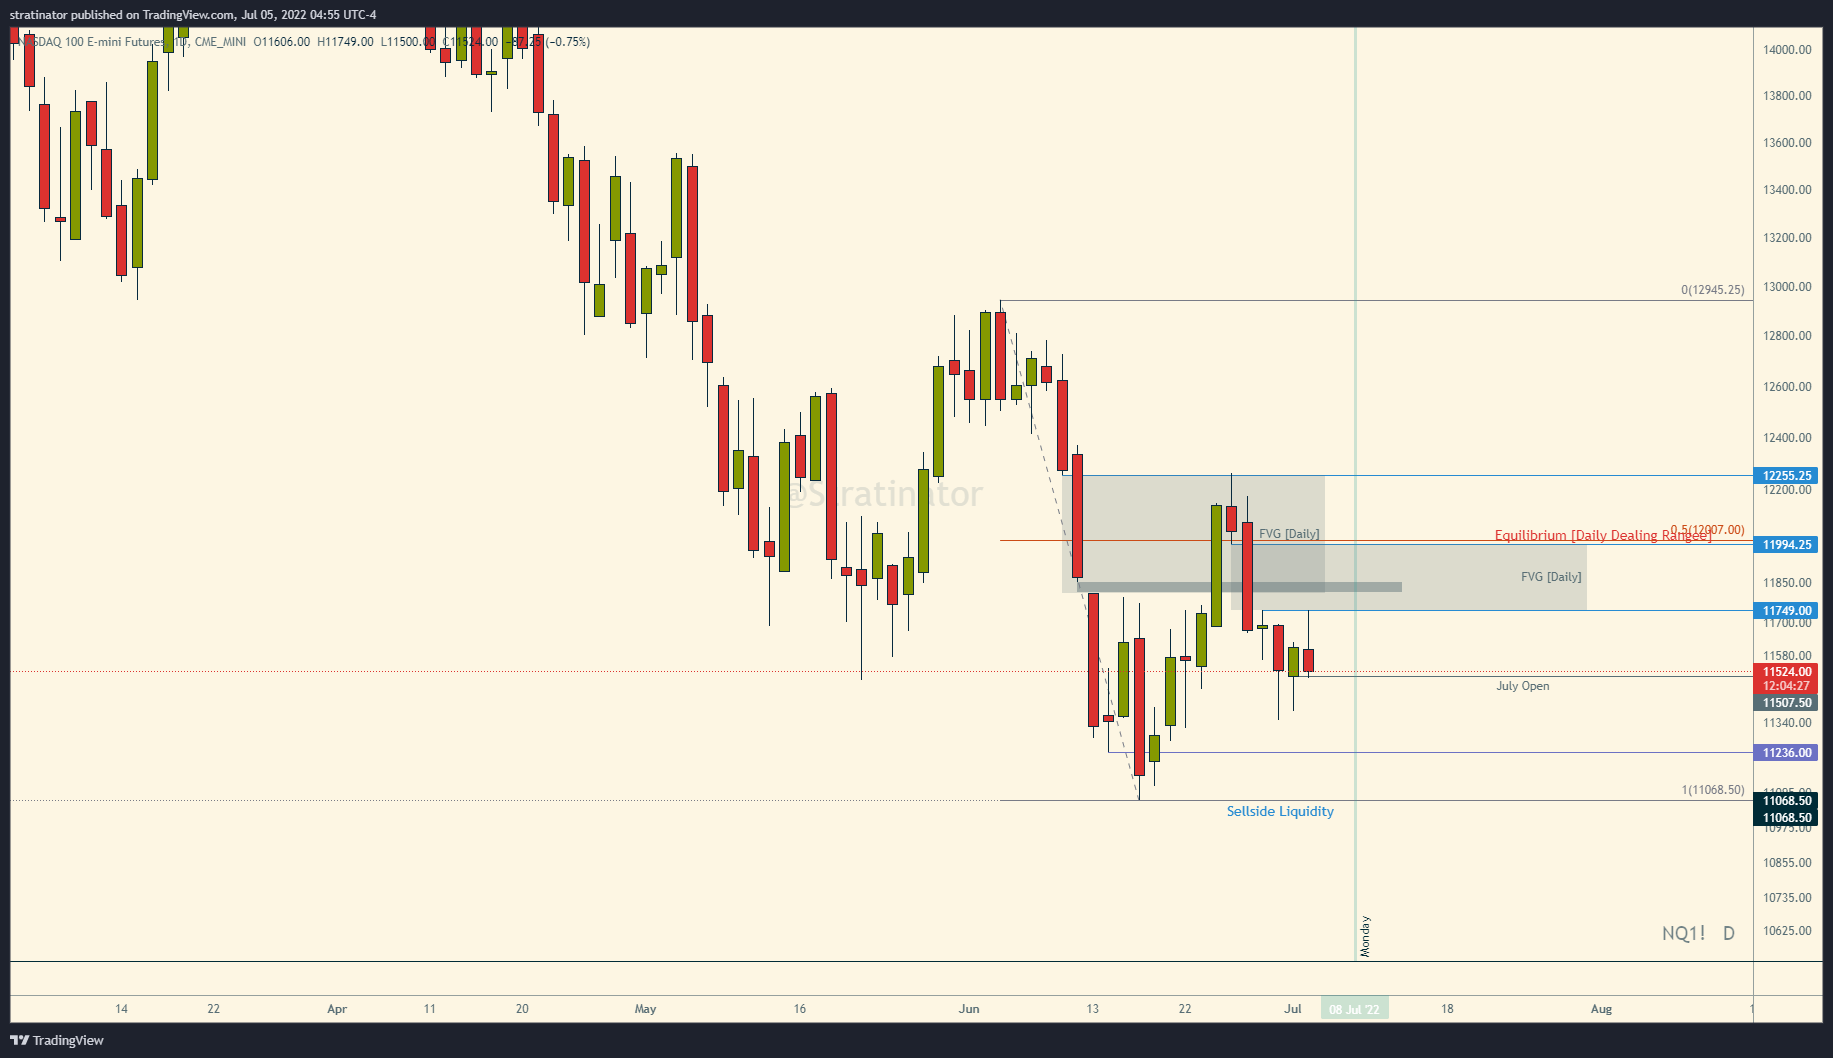
Below Equilibrium of Daily Dealing range, FVG from June 29th (11749) got respected in overnight session today as well.
60min chart
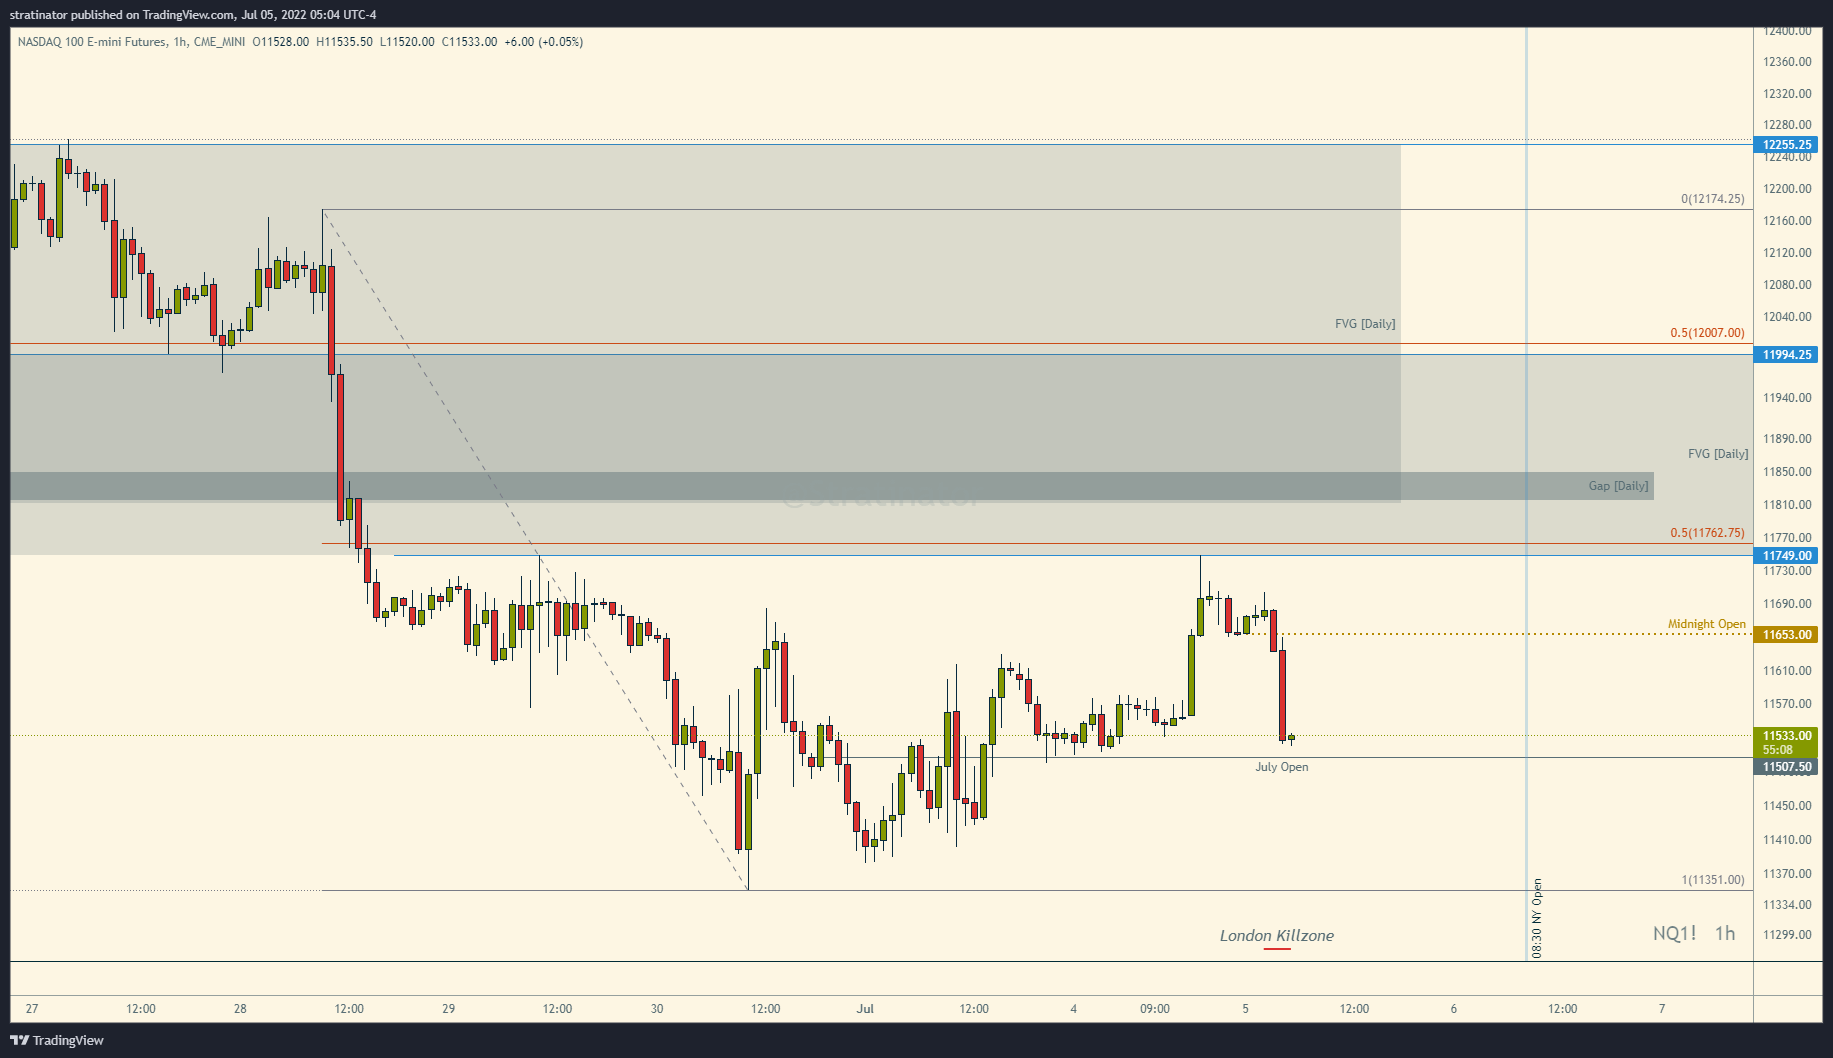
60min also below my anticipated dealing range, Equilibrium at 11762.75, the Asian run up, was sold off in London Killzone.
Interestingly price respected the Daily gap above in Asian session.
Final words
Still figuring out if this format on some days during a month is helpful to show you my observations and ideas.
With that — thanks for reading!
Have a nice green successful week!