My #SundaySwing ideas for the week of 4/11 based on #TheStrat
Surprise, surprise!
Temperatures around freezing and snow on Friday ruined my plans to work on the outside of the house. Typical April weather.
So I had some time to scan through my watchlist of tickers to find some possible #TheStrat trade ideas for a mid-term swing.
For this weeks issue, I’m mainly bearish but found some call trade ideas as well. The two Put trades are very short-term, since we’re in April and May and those months are normally very bullish compared to the start of the year, so we might see a reversal here and the Puts are invalidated.
As written a few times before, in the current market you have to adapt quickly and not stick to a bias and try to hold and hope.
Also keep in mind that stock market is closed on Friday 4/15. Last trading day is 4/14 this week!
Newsletter
If you want to read my #SundaySwing ideas and some other posts I write right in your email inbox, you can subscribe to my totally free Newsletter.
TLDR;
Despite that I have a bearish bias, I found some trade ideas to the upside as well. So lets see how this plays out.
🐻
- $IWM 4/22 195p < 196.68
- $TWTR 4/29 44p < 45.83
🐂
- $COP 4/22 105c > 103.31
- $XLF 5/20 39c > 38.36
Recap of 4/4 SundaySwing
Last weeks #SundaySwing ideas:
Quick and sad:
All longer swings $AAL, $LUV, $NIO triggered and failed. I exited all with a loss beginning of the week as market turned bearish and was glad I didn’t hold because of 6/17 expiration. I will maybe enter again if they hit their entry triggers again.
The only bearish play $PDD I had, ran in the other direction and gapped and never triggered. Strange behavior.
Disclaimer: Not advice, instead these are my ideas based on my knowledge analyzing the charts for possible swing trades based on #TheStrat. So please always do your own due diligence before entering a trade.
Chart setups
Since I keep getting questions about the colors in my charts and setups:
- I always chart in multiple time frames Monthly, Weekly, Daily, and 4-hour or 60min
- Purple lines last months high&low
- Orange lines last weeks high&low
- Blueish lines last day high&low
- Green lines are my targets
- Sometimes white and yellow for intermediate targets or 50% rule setups
- The brownish-boxes on the Daily and 4-hour chart you see sometimes show a gap that hasn’t filled yet.
If some of the broadening formation lines looking a bit curved, it’s because I changed the charts to a logarithmic scale, but they are still accurate.
Outlook
As always, lets take a look at $SPY and $QQQ for a rough prediction of what I think the market will do next. Or course, it’s just my interpretation, so keep that in mind!
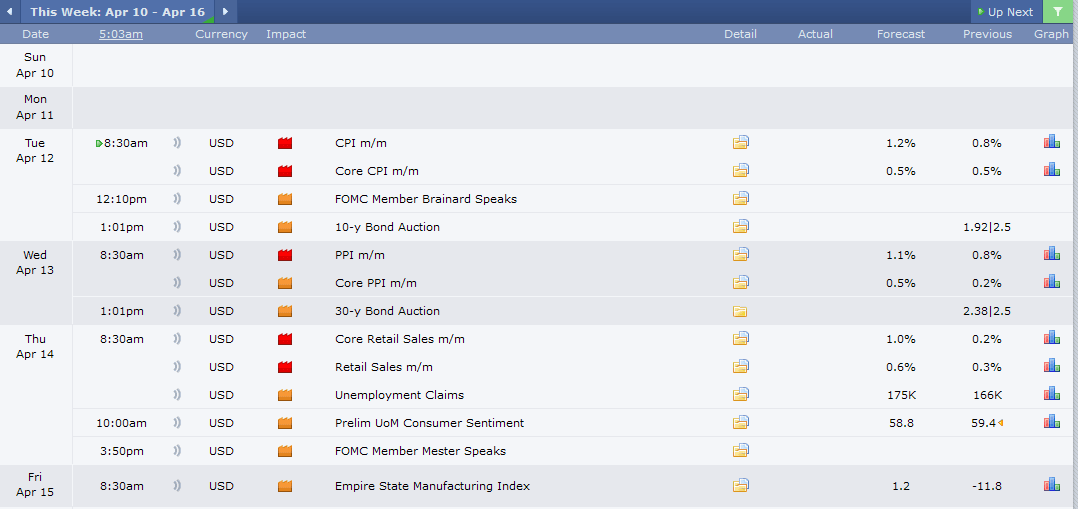
Calendar for upcoming week
$SPY
And bearish again, FTFC is completely red.
Long-term outlook
So this time I pull up the TradingView long-term Strat chart and show the Yearly, Qtr and Month to g give some context.

So $SPY needs to break 462.07 this month first to turn bullish again and a 2u-2u continuation. To the downside there is more room, with 415.12 for a 2u-2d Bearish Reversal. This may sound far away, but $SPY traded at $410-420 6 weeks ago.
So even the longer timeframes are all red now. 421.91 is the #SSS50PercentRule yearly trigger for a possible outside year.
Short-term
I posted a 15min chart last week showing the $SPY Broadening Formation drawn from the 60min chart and it was at the top and we reversed right at this pivot point. So also for the short-term outlook I’m bearish. FTFC is down.

Gap filled on the Daily last week and reversed there. Month is still inside but deep red currently. Friday closed with a 2u-1 inside Day. $457.83 is needed next week for a 2d-2u Bullish Reversal Weekly, but since the week closed red and in the lower third that is a lot of work for the bulls.
$QQQ
Long-Term
Since $QQQ and $SPY move together, the long-term chart looks the same, except that $QQQ is even more red and Bulls have to put in more power to bring it back up.

Short-Term
Looks bearish, FTFC down. Weekly is close to take out the 345.57 from two weeks ago. Month is still inside in the middle, so that will take some bull extra strength to turn this around.

Profits and Stops
I usually target around 25-40% of profits on those swings and decide during the market hours if I leave a runner on a position or close the entire one.
To view the charts in full detail, click to open them in a new browser window.
$IWM 4/22 195p < 196.68
Back on the list, I like to trade IWM, because of liquid option chain and not that expensive premiums like SPY and QQQ. Since small cap stocks look bearish short-term, it’s an idea to the downside. FTFC is down, inside month close to take out last months low.
The idea here is a possible 2d-2d Weekly Continuation. Normally I don’t like continuation trades, but if you look on the weekly chart, you see that the last 3 weeks might form a compound bar to take out the 3 from week of March 14th.
Target is 191.88 but I placed some intermediate term targets on the Daily chart as well, 196.15, 192.88 both are ITM if they hit.
That 191.88 target triggers also the Monthly 2u-2d Bearish Reversal with the ultimate target of 187.92. But the expiration for the above contract is to short.
Therefore the 4/29 190p contract would also a valid option.

$TWTR 4/29 44p < 45.83
Musk news pumped the stock up, the idea here is that $TWTR fills the gap to the downside, since as you see on the daily it couldn’t hold the gap up from Monday.
So I’m eyeing on the Weekly 2u-2d Bearish Reversal below 45.83. The gap goes down to 40.96. If $TWTR triggers it may not go down to the gap in the next two weeks, so I chose the 44p to stay ATM and if it drills deeper these contracts should be very profitable as well.

$COP 4/22 105c > 103.31
A rare occurence, but since $COP looks strong with the possible 2d-2u Weekly Bullish Reversal hammer above 103.31, I added it to my list. First target is 105.14 and probably 107.52.
Sine $COP has earnings on 5/5 I don’t risk to trade into these. Also it’s at ATH so possible exhaustion risk as well. FTFC is up as well.

$XLF 5/20 39c > 38.36
Still an inside month and red, but above 38.58 it turns into FTFC up. The idea here is a possible 3-2d-2u Weekly above 38.36 with targets at 39.33, 39.52 and 40.00. Since these contracts are 5/20 expiration there is room left to the upside.
Above 40.00 would trigger a 2d-2u Month Reversal with possible 41.38 targets.
The 5/20 40c have lots of volume, but I go a bit closer ATM with the 39c, these are more spready, so mid-fill would be preferred. If not, the 40c would also a valid option, maybe even with the 6/17 40c expiration.

The above contracts are just my ideas, I sometimes switch to a further expiration or closer to the money depending on the price action we get.
As always, no trigger no trade and stick to your stops!
With that — thanks for reading!
Have a nice green successful week!