$NQ_F paper trade 2022/4/5 - 1:17 R/R short #ICT
Trying to stick to the habit of journaling my papertrades and since today I found a good setup which I planned before ot happened, here is the journal and my thought process.
No hindsight this time, as you’ll see on the pictures, they were taken during that trade. But of course, still paper.
Note: I had to recreate the annotations because the screenshots I took during the trade showed all the information that I try to show as a development and thought process below, so if somethings seems a bit off or at one screenshot a box is there and on another it’s missing, I apologize.
TL;DR
If you don’t want to read and watch at all images, just scoll down to the Profit heading :)
Daily Bias = 🐻
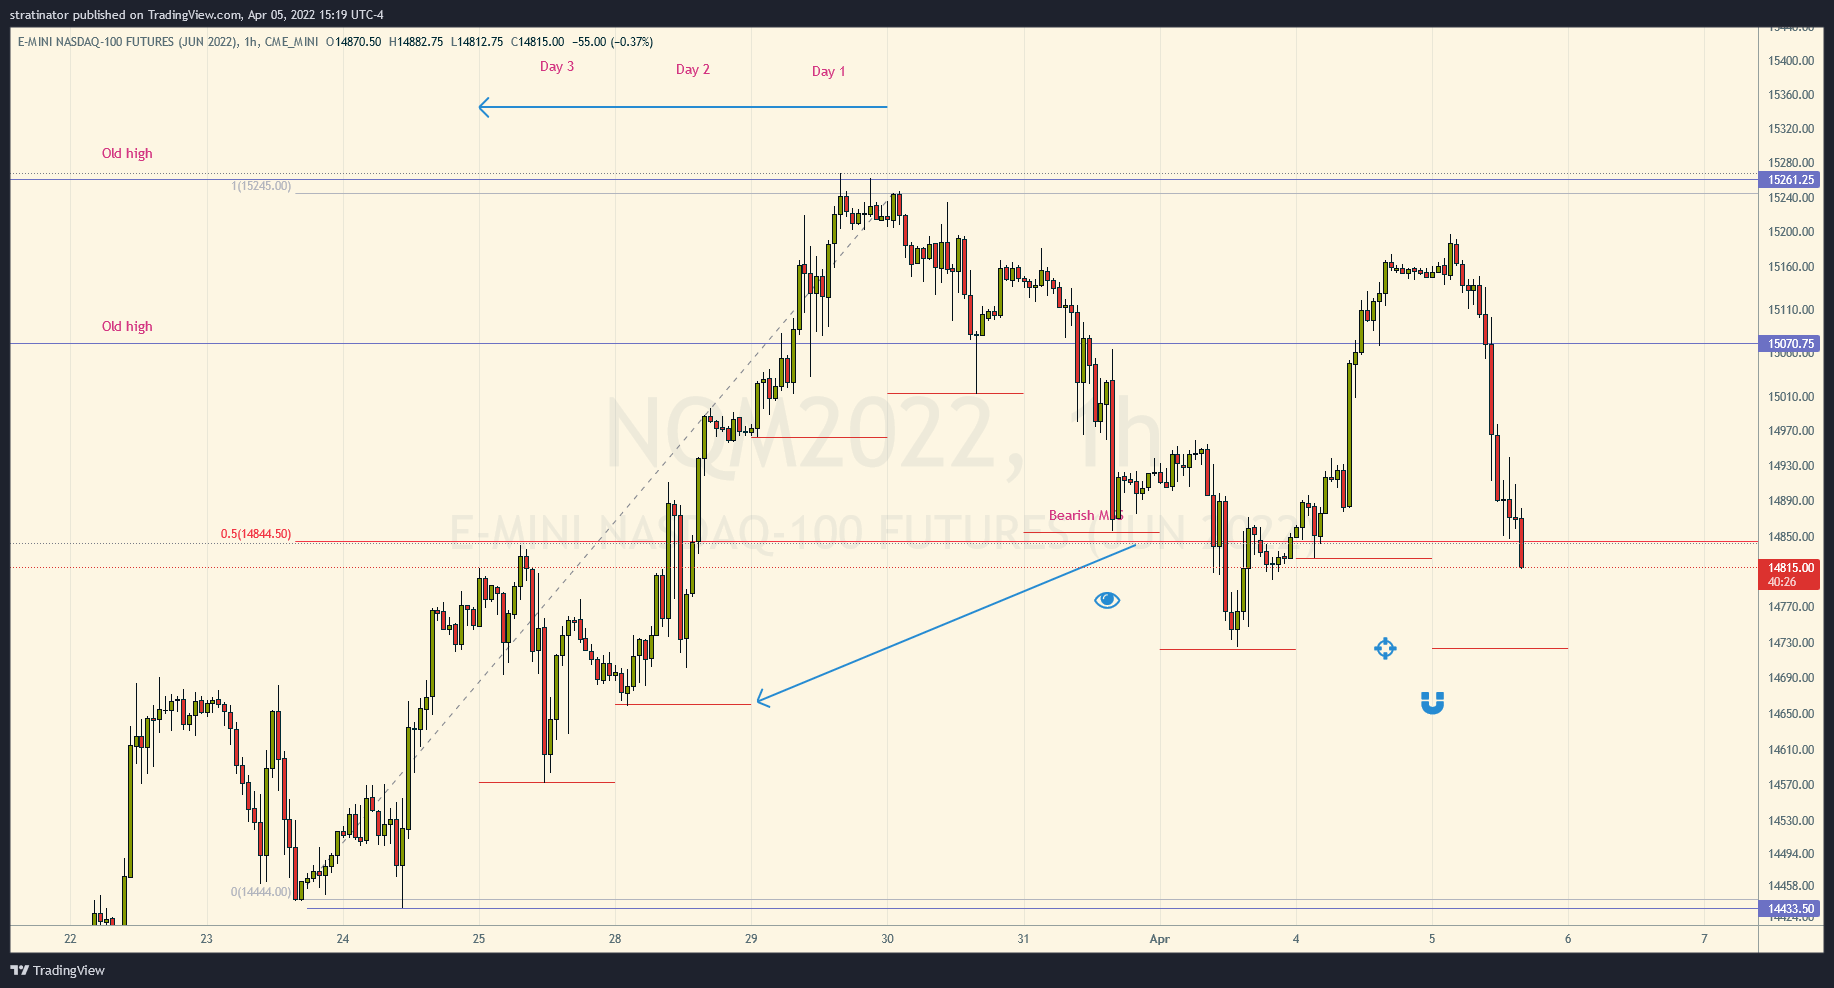
I try to chart and backtest the Liquidity Purge & Revert concept from #ICT to build my daily bias. And since we hade a “purge” as we took out a major high last week, that was my starting point to see if this might work for me.
So I annotated the following $NQ 60min chart two days ago, and while this obviously didn’t worked yesterday, I pulled it out today again and see what happens.
I know that some started to try to not build a daily bias, but I like to concept of this, if it’s right the trading session is a lot of fun, as you see below. But if it’s wrong that it is a real problem, like yesterday. (Maybe more on this later)
Click on the images to open them in full size
This concept is pretty new to me and I have a lot of questions, that might get answered over time, so for now it could also be luck that it worked out today.
Charts without annotations
If you want to look for the setups for yourself, don’t scroll further, above are the naked charts without my annotations. Annotated below…
60min
So with bearish bias, I watched the London session 2AM-5AM and also NY 7AM-9AM as well as NY open 08:30AM to prepare like I do everyday when I find time to trade.
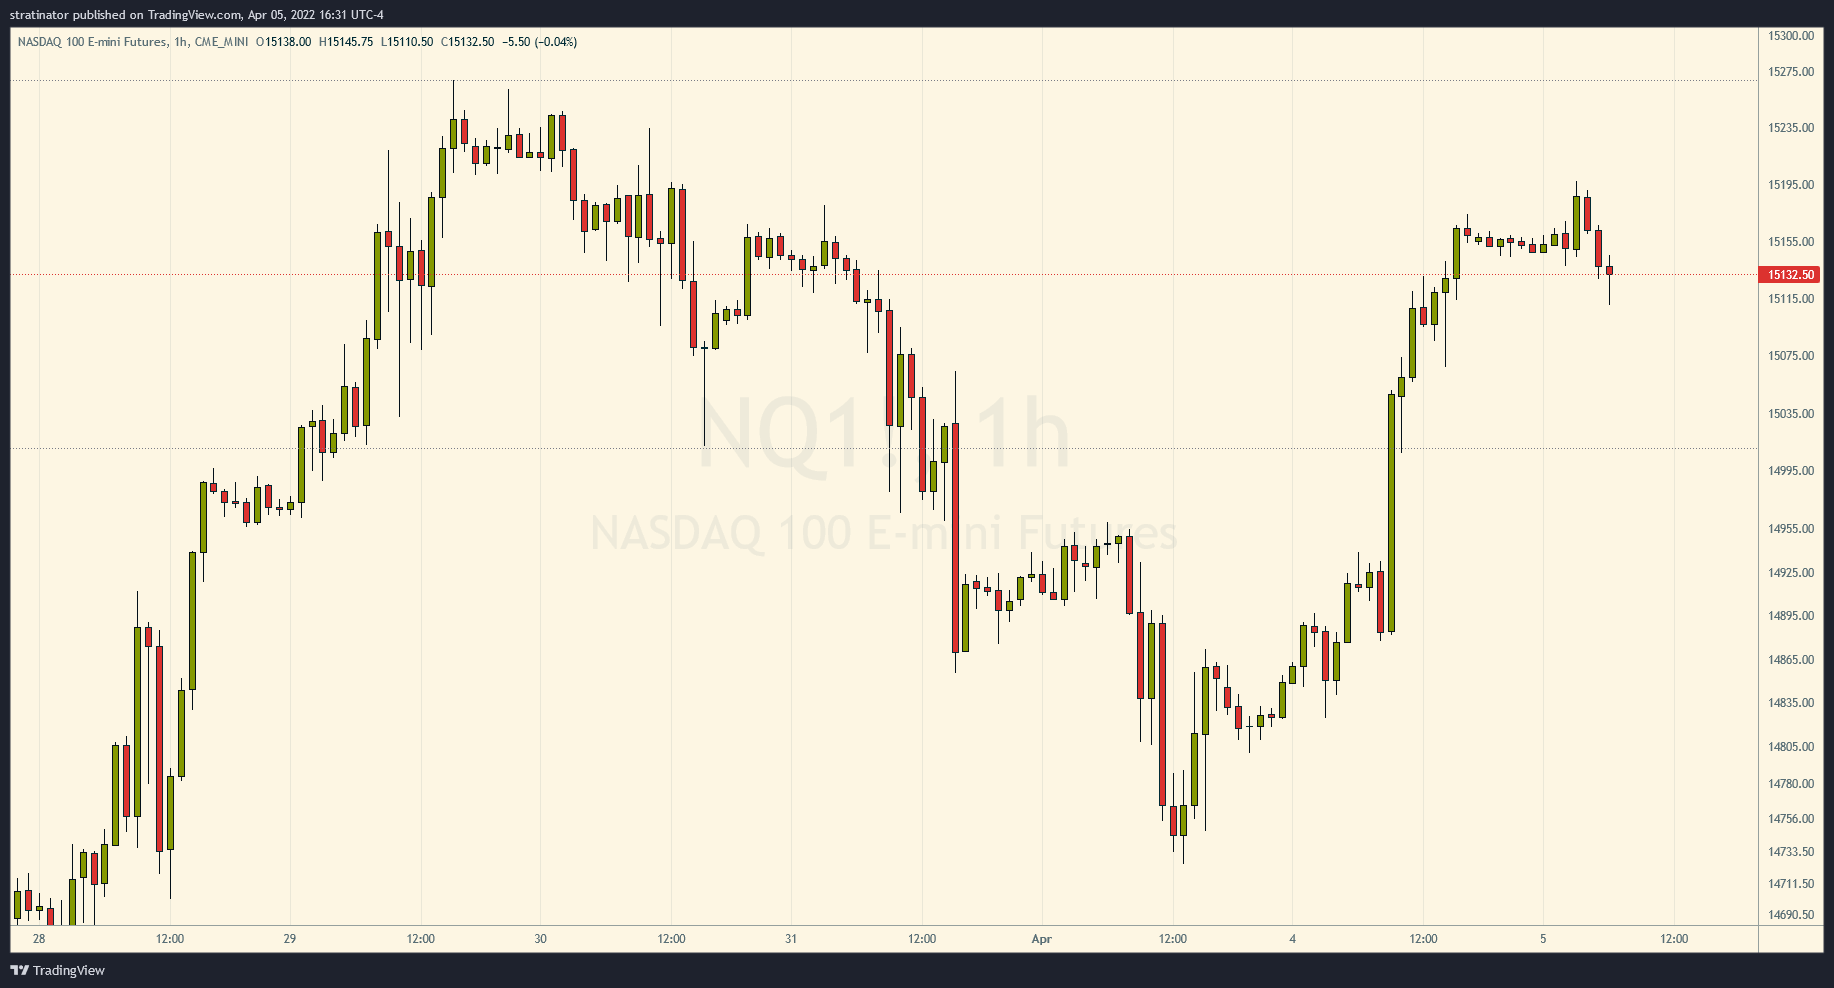
This was the 60min naked NQ chart
15min
On the 15min before open this was presented to me, now if you want to watch for yourself, don’t look further down :-)
5min
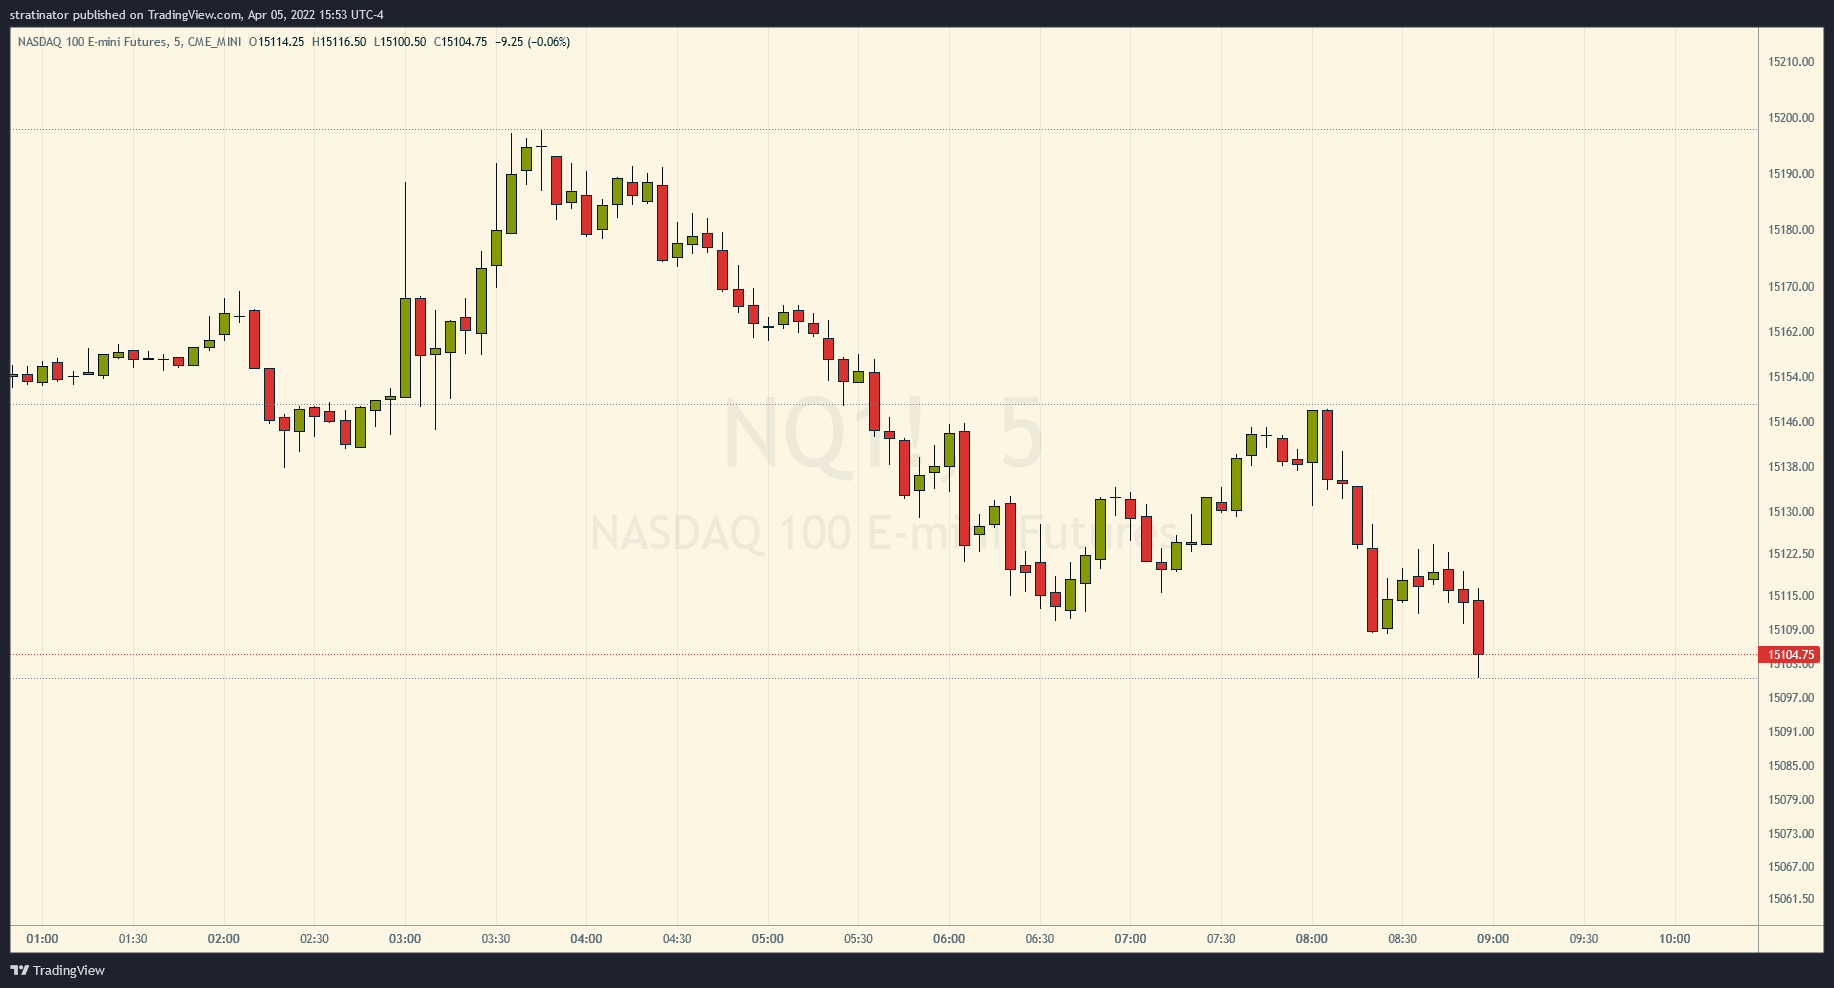
Based on that information I had on these three charts plus my daily bias I saw my chance to short NQ here.
Annotated charts
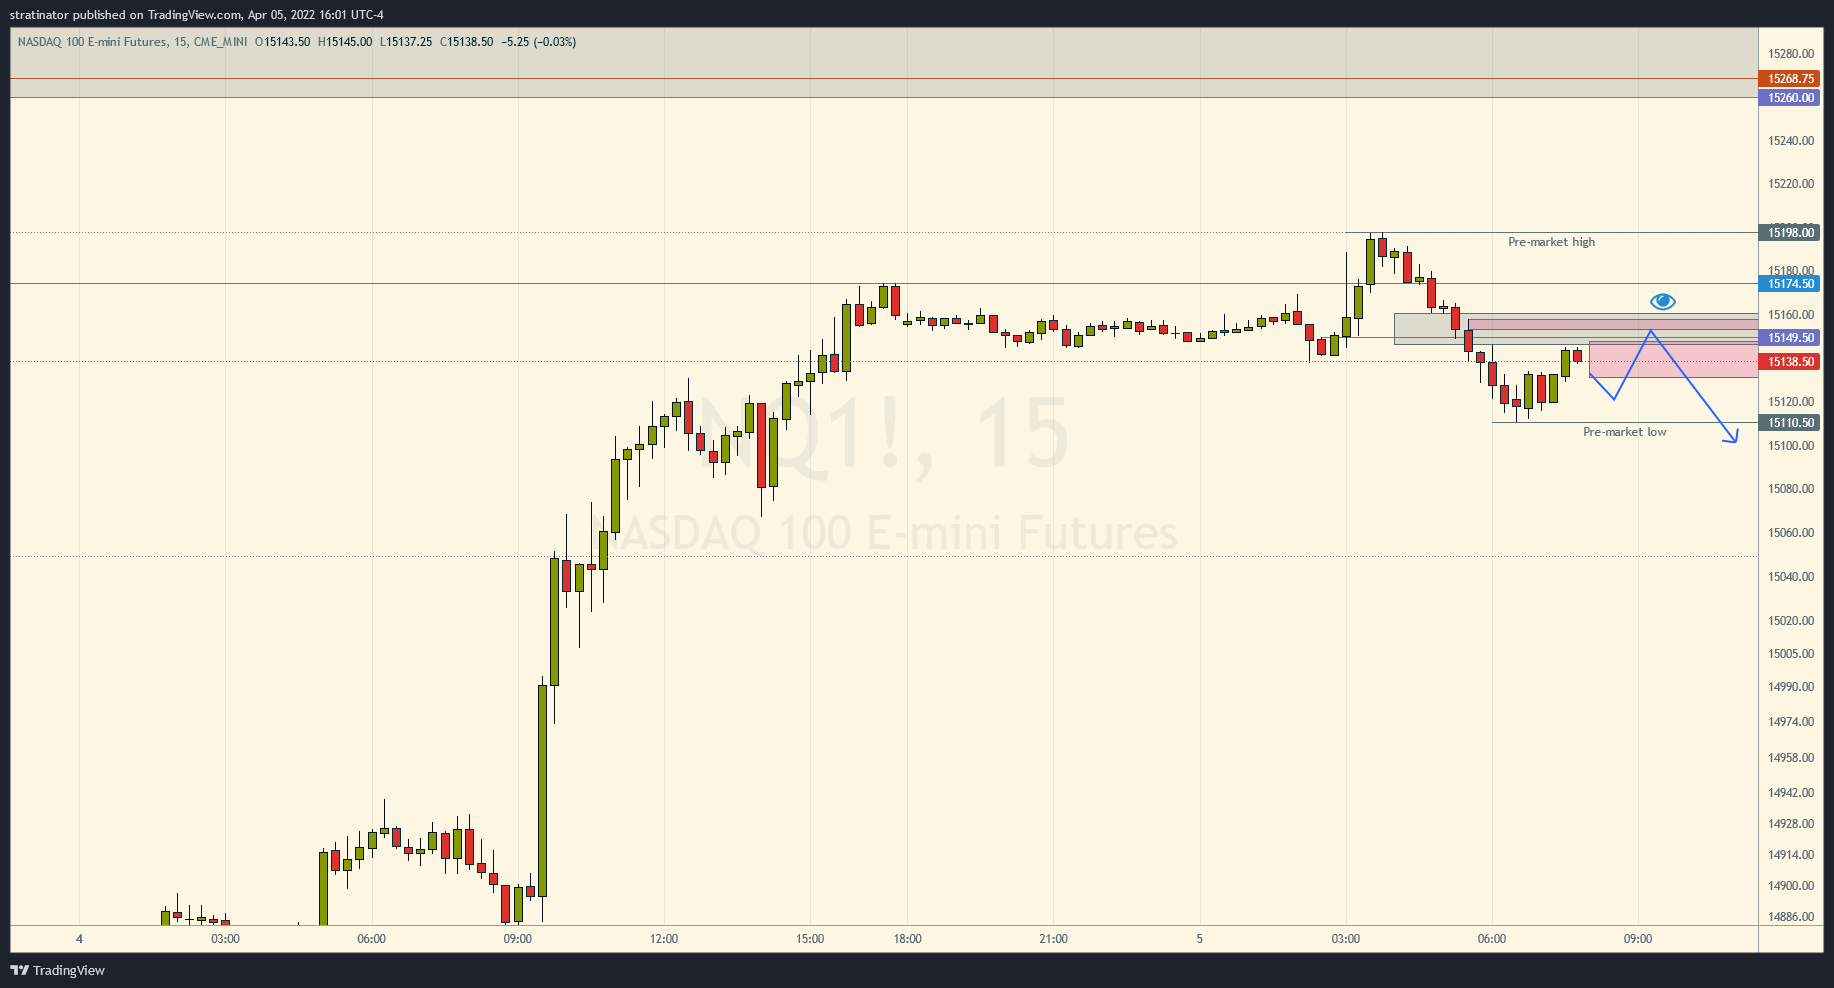
60min
After NQ traded above 4/4 high - the blue line 15174.50, I expected a reversal after I saw that drop down and the created imbalance there. The grey box is the FVG I saw in that timeframe.
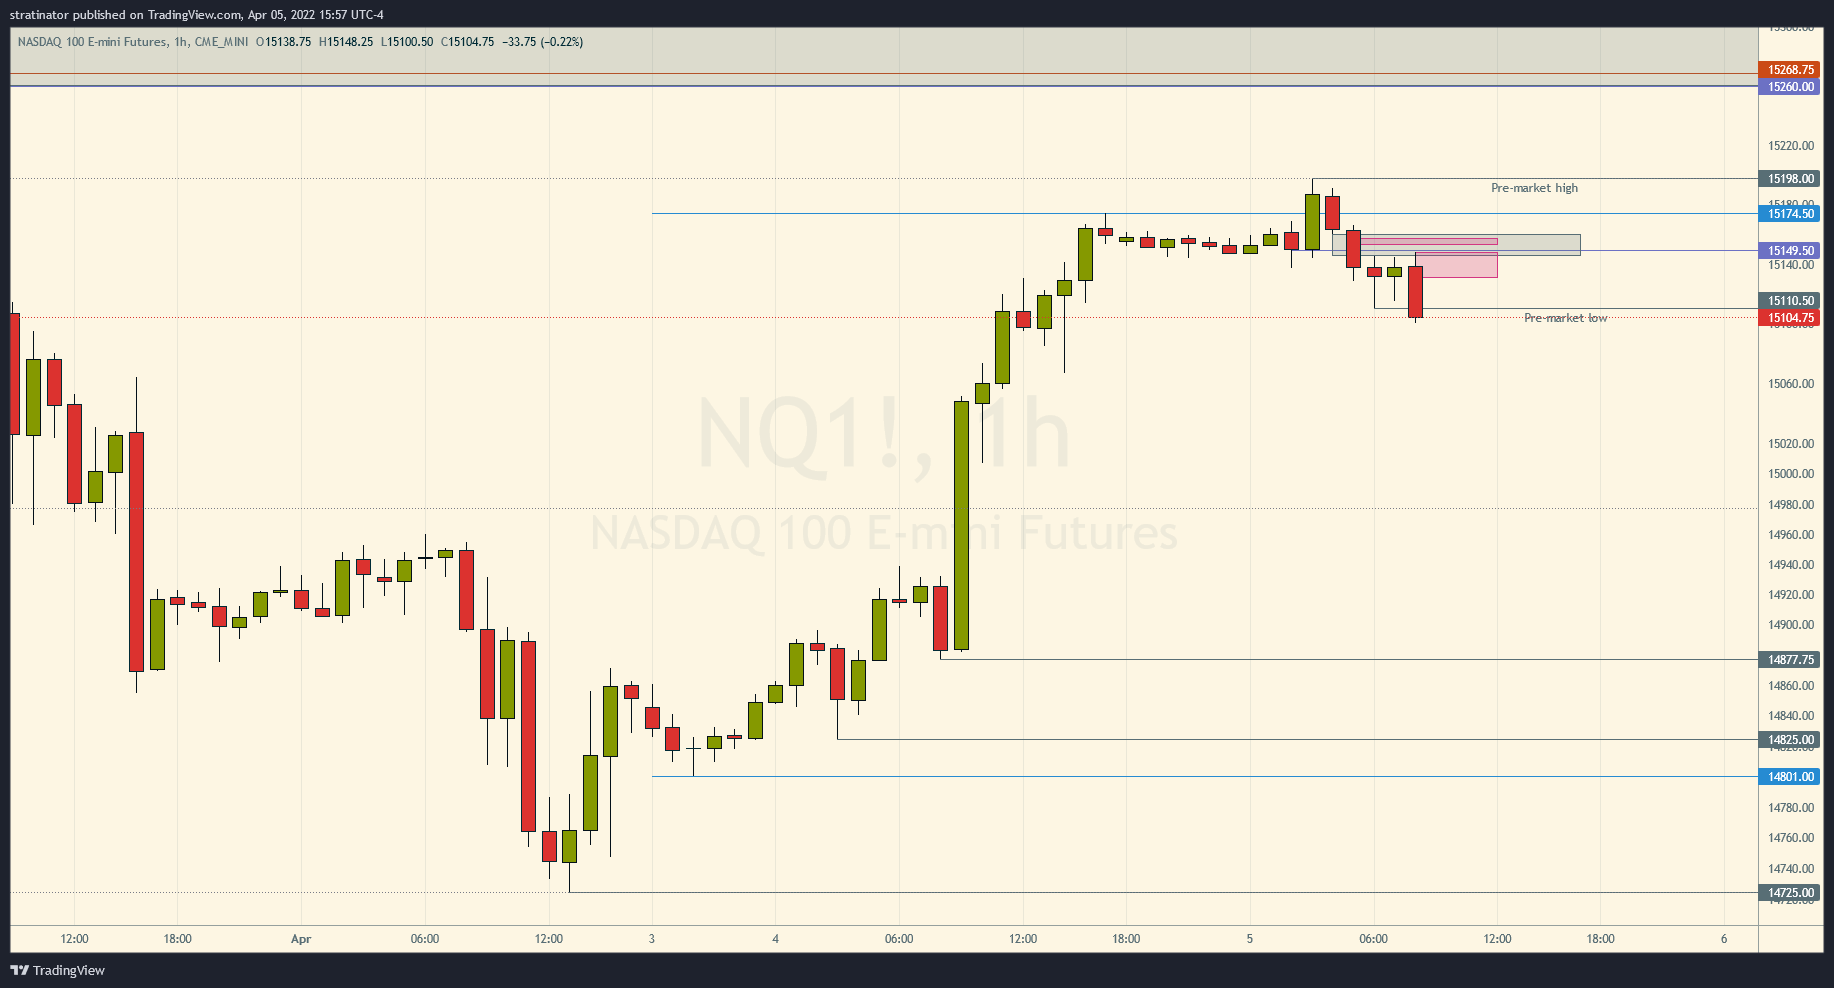
The purple boxes are Orderblocks that I forgot to hide here, but you’ll see them shortly where I identified them.
So FVG spotted, now trailing it down, next 15min.
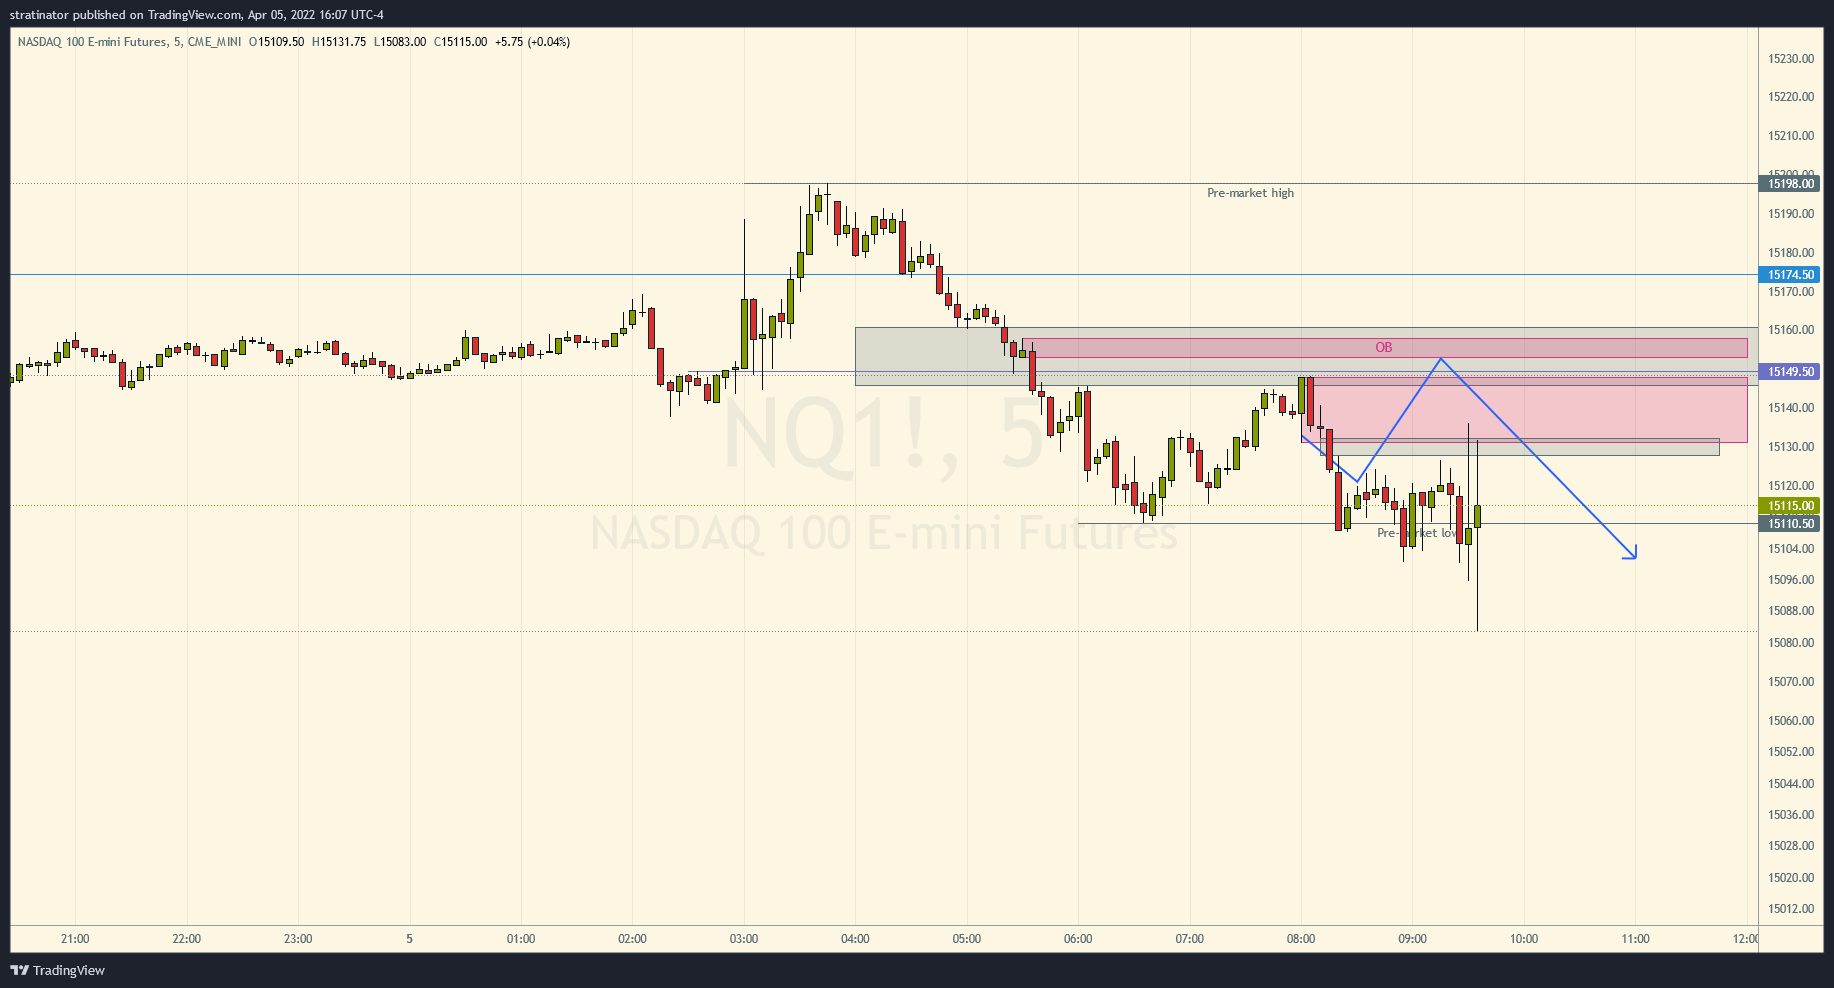
15min
First trade idea was the following one, trading up into the small OB in that FVG and then down.
But that not worked out, because I spotted another setup shortly after the above one. Which was the final trade.
Now in hindsight, it was more risky, because at that time the price could have traded back into the above Orderblock. I realized this later when I was in the trade, but did not thought about it when I entered. Have to keep this in mind for later.
5min with entry and Market Structure targets
The 5 minute chart showed me another slightly larger Orderblock and an imbalance, the one you saw above in purple already, now with the candles developed.
The above image, sadly shows a few candles to much when price traded already into the orderblock, I show the short-entry widget down below, apologies :)
So I saw my chance, went back to the 15min chart to draw the Market Structure Levels from Swing high->low to see what we can expect from this trade if it works.
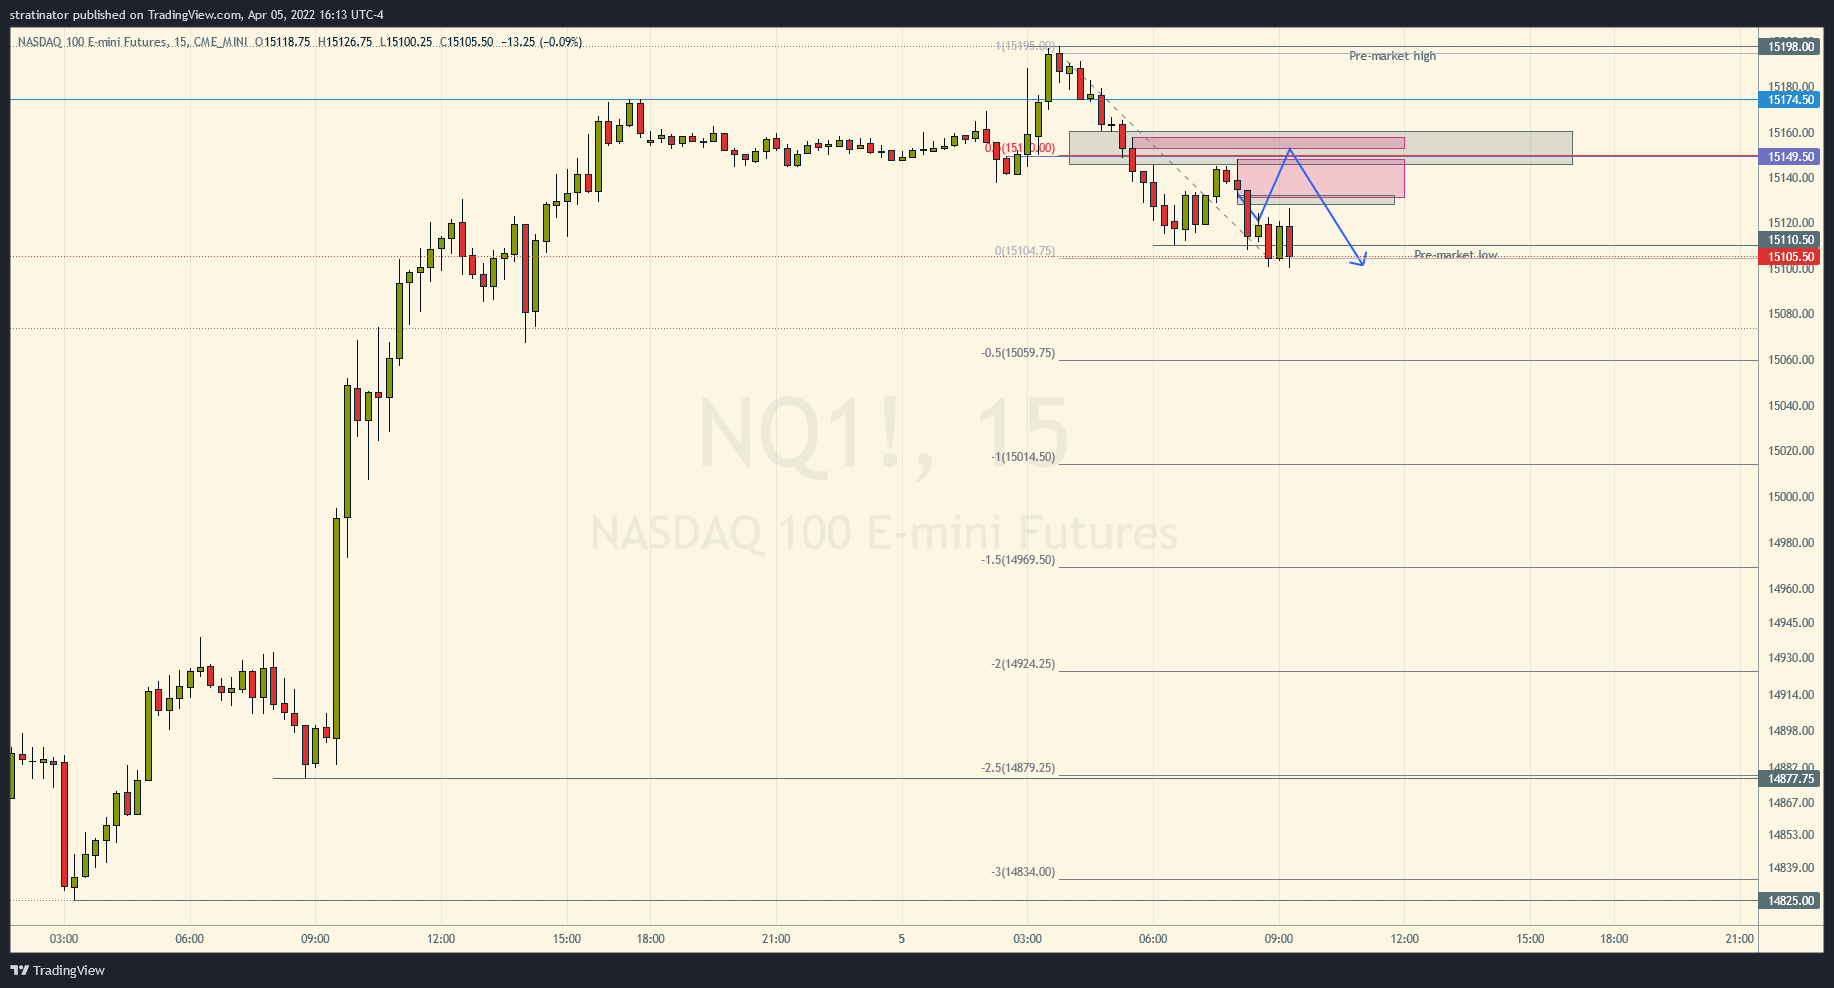
I’m still unsure of the optimal placement, so I selected the obvious high and the most recent swing low, which gave the above levels.
At this point in the morning I did not even expect that we will go down that far, but at one point I have to trust the process.
Right at 09:30AM NQ traded into that FVG and Orderblock and triggered my LMT Sell order for 2 NQ contracts - paper! - and it worked from start to finish without even going up near the stop.
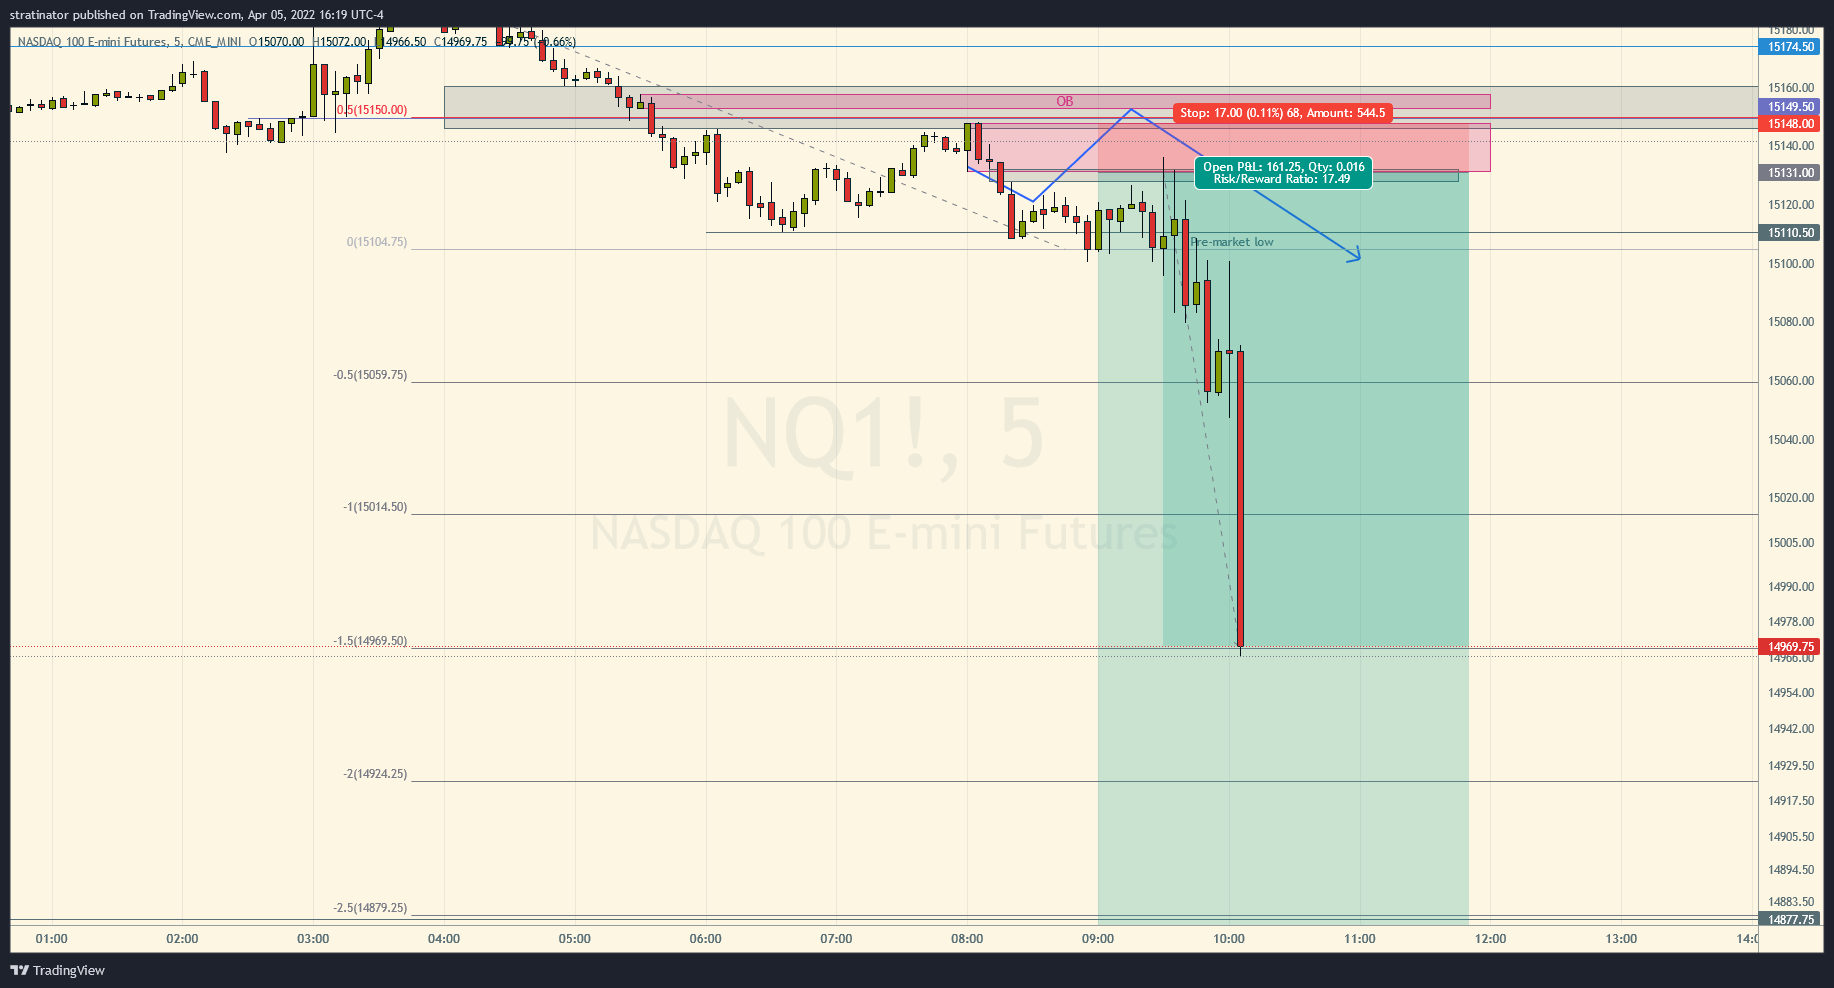
Profit
So, without further extra notes, the Profit taker was placed on the -3.0 level of the Market Structure Levels. The top of orderblock was my stop - 17 handles NQ so basically $680 for at least an expected 1:3 trade, this would be around the first -0.5 level 15059.75.
Short before NQ hit my profit taker, I took the last screenshot before exit:
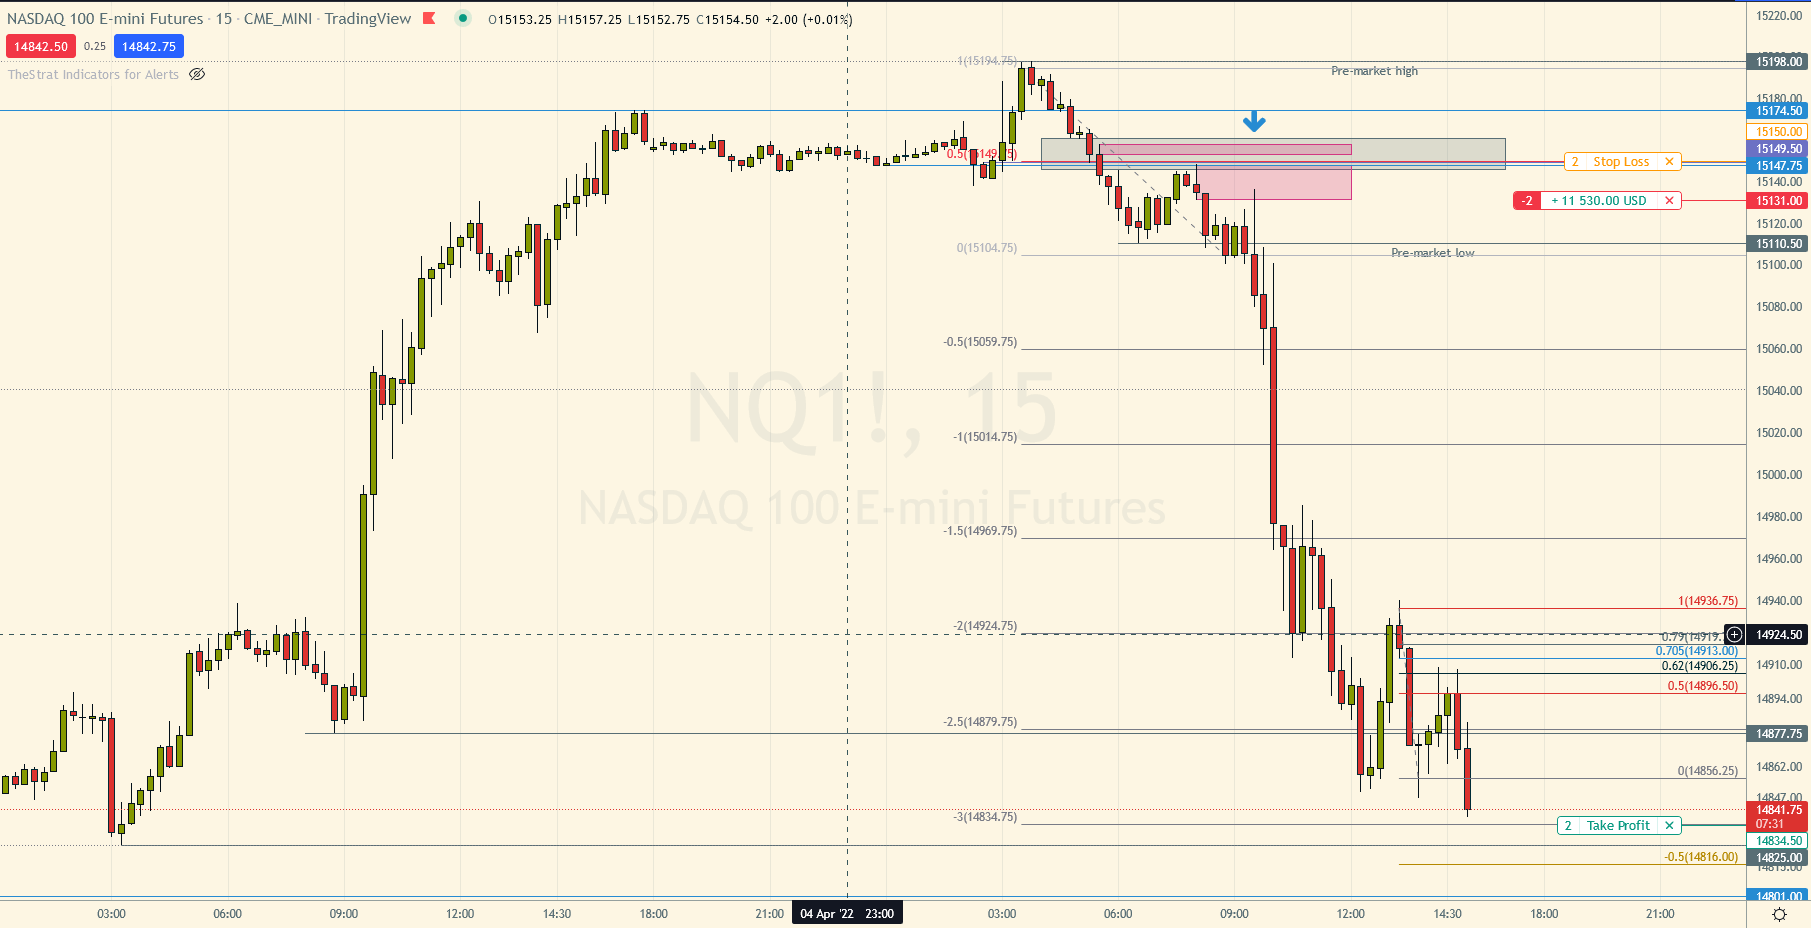
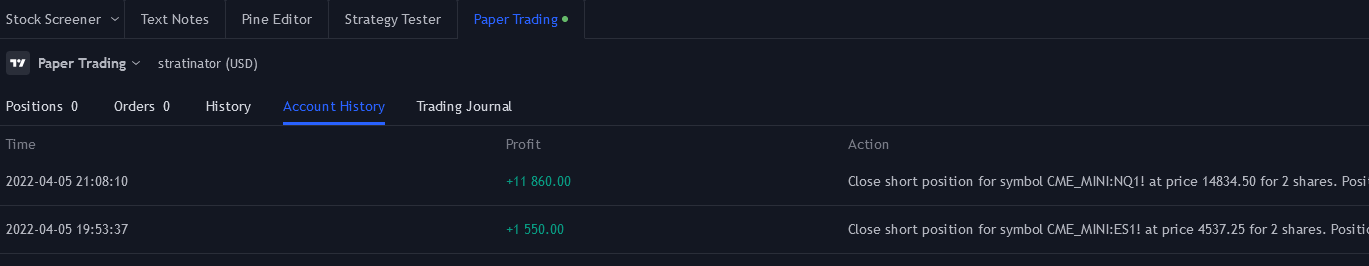
At exit, the trade made $11.860 profit with just 2 NQ contracts hold the whole day. Crazy.
Final image, market still open, but I exited there and did not trailed it even more down.
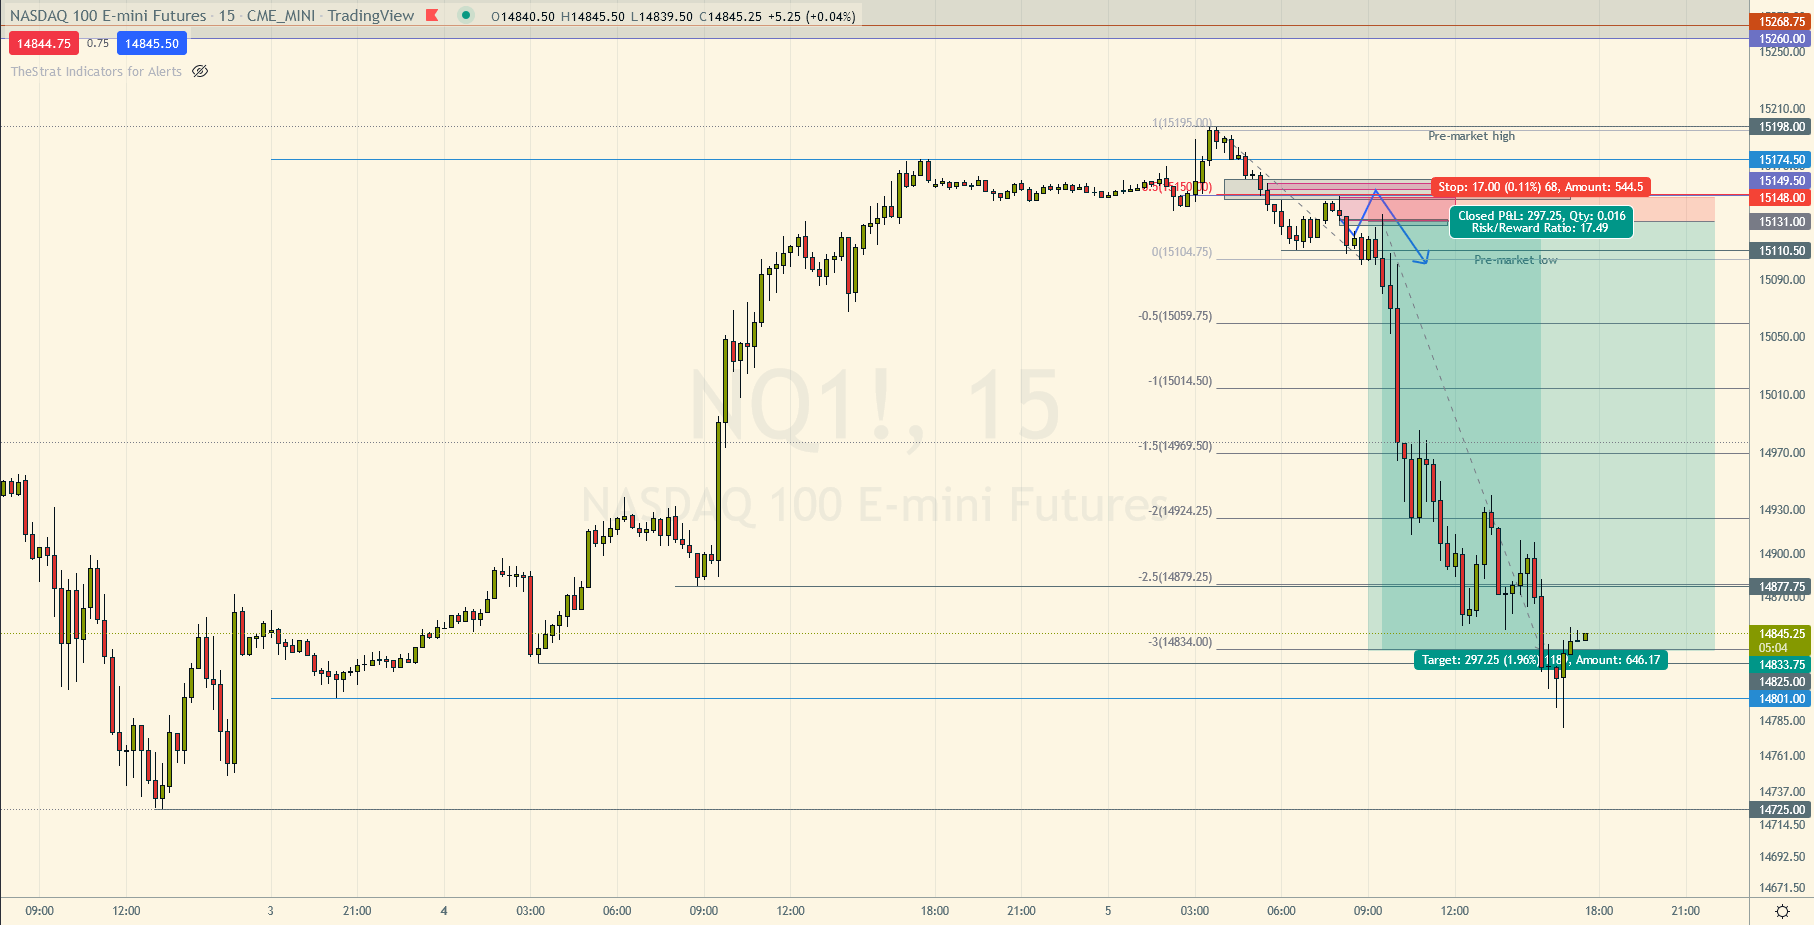
With that — thanks for reading!