Notes of $MNQ_F 3/22 #ICT for my reference 9.6:1 R/R trade
I couldn’t figure out yesterday why $NQ and $ES pumped so hard from the open and yesterday and thought it was just “bullish”.
That reason didn’t give me any peace. Here is the science of this setup with a 9.6:1 risk/reward and why it really worked out.
So I looked back into yesterdays charts 3/22 and tried to annotate all the things #ICT teaches in his Youtube channel Mentorship 2022 program.
And as he always states, market is run by algos and there are always the same fractals and repetitions you can spot. Boy, is he right!!
Here is now my hindsight annotated chart of $MNQ_F from 3/22 with some extra descriptions to each image.
You can click on the images to see them in the large version
Higher timeframe 60min
Showing the naked 60min chart for day of 3/22.

Now the fully annotated chart also on the 60min.

There is a 60min FVG right before market open from Overnight session 3:00AM -> 5:00AM, the grey box.
The little red triangle on the 5:00AM candle is an ITH (also “King High”, “Key High”), which is violated to the upside from the 9:00 candle (marked that with a 💡).
That is our Imbalance! = Bullish Market Structure Shift (MSS) Now we can start to dig deeper into lower time frames.
This info from here is all in the ICT videos Episode 1-5 and 12/13.
15min

The 5min Orderblock in purple is from the lower timeframe, that is not visible in the 15min. But you could have also chosen the last red downclose candle as an entry signal on the 15min chart.
The usage of these Fib levels is shown in ICT Episode 12 for reference.
5min
Now the lowest timeframe I use for this and also like the most besides the 15min one.

The big grey zone is the 60min FVG from above, everything else mentioned above is also there.
- Red Triangle
- Red 💡 for marking the Bullish MSS
- Orderblock purple zone
- Additonal 5min FVG, not needed
As we know from the videos, Orderblocks are the real trigger.
I don’t think I need to write more about the entry trigger, price drops into the 5min Orderblock and 🧨 explodes up.
Now, remember the Market Structure Levels from the 15min chart, they are also shown here. ICT talks about a -1.5 as profit level as ideal (Watch Episode 12! :-) ) and now watch where price trades into. 👀
For fun, last image which shows the TradingView Long Entry Widget with Risk/Reward on that trade.
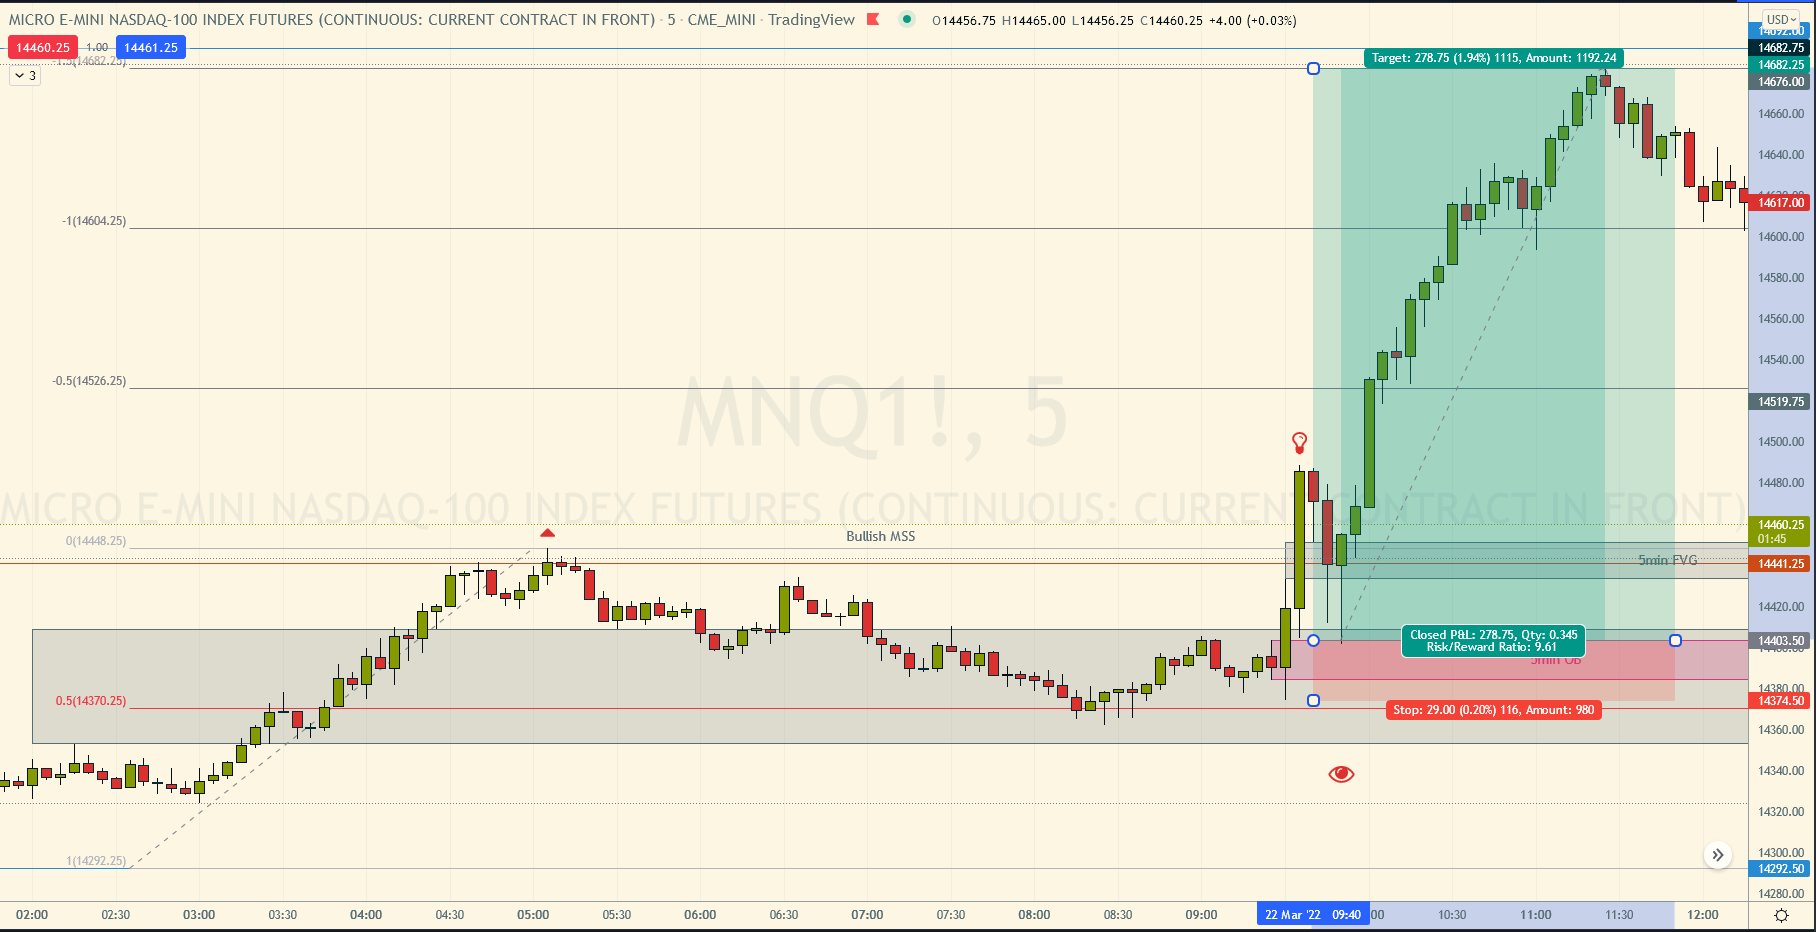
Entry is right at the top of the Orderblock (Watch Episode 12!), Stop gets right below the Orderblock. Profit targets up to the -1.5 level.
9.61:1 Risk/Reward -> 278 handles long, even on $MNQ this would be $556/contract, with 29 handles risk. Crazy and precise!